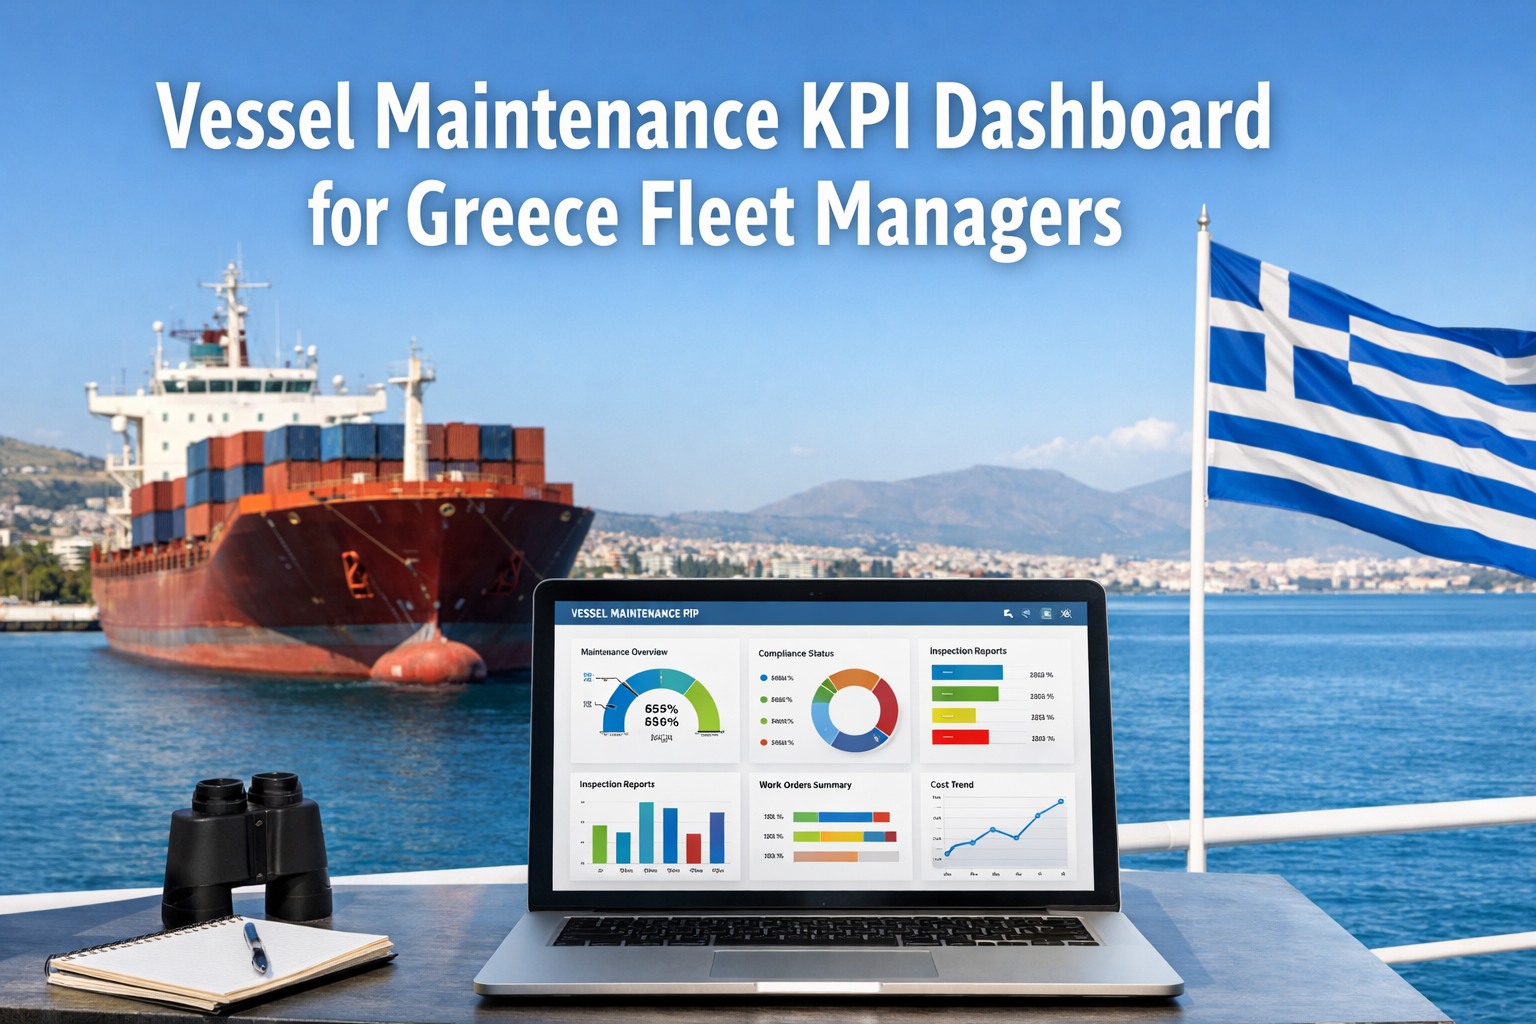
Greek fleet managers overseeing 4,100+ vessels across cargo shipping, tanker operations, and specialized maritime services face critical challenge: transforming vast quantities of maintenance data, compliance records, and operational metrics into actionable insights driving performance improvement and cost reduction. Traditional maintenance management generates data—work orders completed, spare parts consumed, equipment failures recorded, survey findings documented—but without systematic analytics, this information remains trapped in disconnected spreadsheets providing no visibility into fleet-wide performance trends, emerging failure patterns, or optimization opportunities. The fleet managers achieving competitive advantage implement integrated KPI dashboard platforms transforming raw maintenance data into visual performance metrics: equipment reliability trends across vessel classes, maintenance cost benchmarking identifying high-spend outliers, compliance status monitoring preventing certificate expirations, and predictive analytics flagging developing issues before failures occur. Greek fleet managers ready to implement maintenance KPI dashboards—start your free trial can leverage Marine Inspection's analytics platform designed specifically for Greek maritime operational complexity across diverse vessel types, multi-flag operations, and Hellenic Coast Guard regulatory requirements.
Greek Fleet Size
4,100+
Vessels requiring performance monitoring
Data Points Tracked
50-80K
Monthly maintenance data points per fleet
Decision Speed
85%
Faster with real-time KPI dashboards
Cost Reduction
18-25%
Maintenance costs through data-driven optimization
Essential Vessel Maintenance KPIs: Metrics Driving Greek Fleet Performance
Effective fleet management requires tracking key performance indicators providing visibility into maintenance effectiveness, equipment reliability, and operational efficiency. Greek fleet managers implementing comprehensive KPI dashboards—schedule demo monitor five essential metric categories: equipment reliability (unplanned downtime, mean time between failures, failure frequency by equipment type), maintenance efficiency (preventive versus corrective maintenance ratio, planned maintenance completion rate, maintenance backlog), cost performance (maintenance cost per vessel, cost per operating day, budget variance), compliance status (certificate expiration countdown, survey preparation progress, audit finding closure rate), and spare parts optimization (inventory turnover, stockout incidents, critical spares availability). These metrics transform from abstract numbers to actionable insights when presented through visual dashboards highlighting trends, identifying outliers, and flagging performance degradation requiring management attention.
Reliability
Equipment Reliability Metrics
• Unplanned Downtime Hours per Vessel per Month
• Mean Time Between Failures (MTBF) by Equipment Category
• Critical Equipment Failure Frequency
• Emergency Repair Incidents per Quarter
Insight: Identifies chronic reliability issues requiring root cause analysis or equipment replacement decisions
Efficiency
Maintenance Efficiency Metrics
• Preventive vs Corrective Maintenance Ratio (Target: 70/30)
• Planned Maintenance On-Time Completion Rate
• Maintenance Backlog (Overdue Work Orders)
• Work Order Completion Time (Planned vs Actual)
Insight: Shows whether maintenance program proactive (preventive) or reactive (corrective), driving program improvements
Cost
Cost Performance Metrics
• Maintenance Cost per Vessel per Month
• Maintenance Cost per Operating Day
• Budget Variance (Actual vs Planned Spending)
• Emergency Repair Cost as % of Total Maintenance
Insight: Benchmarks vessels against fleet average, identifying high-cost outliers requiring investigation
Compliance
Compliance Status Metrics
• Certificates Expiring Within 90 Days (Count & (%)
• Survey Preparation Progress (% Complete)
• PSC Deficiency Rate per Inspection
• Audit Finding Closure Time (Average Days)
Insight: Prevents compliance incidents through early warning of upcoming deadlines and outstanding corrective actions
Inventory
Spare Parts Optimization Metrics
• Inventory Turnover Rate (Annual)
• Stockout Incidents per Month
• Critical Spares Availability (%)
• Obsolete Inventory Value
Insight: Balances inventory costs against parts availability, optimizing stock levels preventing delays while minimizing capital tied in spares
Real-Time Dashboard Visualization: Transforming Data into Insights
KPI dashboards transform maintenance data from static spreadsheet reports into dynamic visual platforms providing immediate performance visibility. Greek fleet managers using Marine Inspection's dashboard platform access real-time metrics through customizable views: executive summary dashboards showing fleet-wide performance at-a-glance with traffic-light indicators (green/yellow/red) highlighting areas requiring attention, vessel-specific dashboards drilling down to individual ship performance comparing against fleet benchmarks, equipment category dashboards tracking reliability trends across main engines, generators, pumps, and critical systems, and trend analysis dashboards displaying performance trajectories over time identifying improvement or degradation patterns. Visual presentation through charts, graphs, and heat maps enables rapid pattern recognition impossible through numerical tables—fleet managers immediately identify which vessels underperforming, which equipment types experiencing elevated failure rates, and which cost categories exceeding budgets.
Immediate Performance Visibility
Real-time metrics updated hourly showing current fleet status versus waiting days/weeks for monthly reports
Trend Pattern Recognition
Visual charts displaying performance trajectories over time identifying improvement/degradation requiring intervention
Exception-Based Management
Automated alerts highlighting outliers and KPIs exceeding thresholds focusing management attention on issues requiring action
Benchmarking Capability
Individual vessel comparison against fleet averages identifying high/low performers and best practice opportunities
Implement Real-Time KPI Dashboard for Greek Fleet
Marine Inspection's analytics platform provides customizable dashboards, automated reporting, trend analysis, and benchmarking capabilities—transforming maintenance data into actionable insights driving 18-25% cost reduction and performance improvement.
Automated Report Generation: Compliance & Management Reporting
Greek fleet managers require systematic reporting for multiple stakeholders: monthly management reports showing fleet performance versus targets, quarterly board presentations demonstrating operational efficiency and cost control, annual audit reports documenting ISM Code compliance, survey preparation reports for classification societies, Hellenic Coast Guard inspection documentation, and PSC deficiency analysis for maritime authorities. Manual report generation consumes 20-30 hours monthly compiling data from multiple sources, creating charts, and formatting presentations. Marine Inspection's automated reporting generates these deliverables automatically from underlying maintenance database: pre-configured report templates matching each stakeholder's requirements, scheduled automatic generation (monthly reports delivered first business day each month), customizable metrics and visualizations, and export formats supporting PowerPoint, PDF, Excel. Greek fleet managers implementing automated reporting—sign up now report 85% reduction in report preparation time while improving data accuracy and consistency across stakeholder communications.
Predictive Analytics: Identifying Issues Before Failures Occur
Advanced KPI dashboards transcend historical reporting by incorporating predictive analytics forecasting future performance based on current trends. Marine Inspection's AI-powered analytics identify patterns indicating developing issues: gradual increase in main engine fuel consumption suggesting degrading injectors before complete failure, rising auxiliary generator repair frequency indicating replacement decision approaching, declining preventive maintenance completion rates predicting future reliability problems, and increasing spare parts consumption for specific equipment categories flagging chronic issues requiring root cause analysis. These predictive insights enable proactive management interventions—scheduling major overhauls during planned dry-dock periods rather than emergency repairs at sea, replacing aging equipment before catastrophic failures, and adjusting maintenance programs based on actual performance rather than assumptions.
Equipment Replacement Timing
Analytics tracking repair frequency and costs identify when equipment transitions from economical repair to replacement justification—preventing continued high repair spending on aging equipment approaching end-of-life.
Maintenance Program Optimization
Historical failure data reveals which preventive maintenance intervals optimal versus manufacturer recommendations—extending service intervals for reliable equipment while shortening for problematic systems.
Spare Parts Demand Forecasting
Consumption pattern analysis predicts future parts requirements enabling proactive procurement avoiding stockouts while minimizing excess inventory capital.
Compliance Risk Prediction
Survey finding trends and maintenance completion rates forecast PSC inspection outcomes enabling targeted improvement efforts preventing deficiencies.
Fleet Benchmarking: Identifying Best Practices & Performance Outliers
KPI dashboards enable systematic fleet benchmarking comparing individual vessel performance against fleet averages, sister ship comparisons, and industry standards. Greek fleet managers identify high-performing vessels demonstrating best practices transferable across fleet, low-performing vessels requiring investigation and improvement plans, and equipment-specific performance variations revealing maintenance effectiveness differences between vessels. Benchmarking analysis answers critical questions: Why does one vessel achieve 85% preventive maintenance ratio while sister ship only 62%? What maintenance practices enable certain vessels operate 15% below fleet average maintenance costs? Which vessels consistently pass PSC inspections without deficiencies versus others averaging 2-3 deficiencies per inspection? Systematic benchmarking transforms individual vessel data into fleet-wide improvement opportunities.
"Managing performance across our 38-vessel Greek fleet through monthly Excel reports became inadequate by 2024. We received maintenance data weeks after month-end, identified problems only after they became crises, and lacked visibility into which vessels performing well versus struggling. Implementing real-time KPI dashboard platform transformed fleet management from reactive to proactive. We now see current fleet performance updated hourly, automated alerts flag vessels exceeding cost thresholds or missing preventive maintenance targets, benchmarking identifies best practices from high-performing vessels transferable to underperformers, and predictive analytics forecast equipment replacement needs 6-9 months before failures. The platform reduced our fleet average maintenance cost 22% through data-driven optimization, decreased unplanned downtime 35% through early intervention on developing issues, and cut management reporting time 88%—but the real transformation is strategic decision-making based on comprehensive data visibility versus historical guesswork and assumptions."
Greek Maritime Regulatory Compliance Reporting
Greek vessel operators face specific reporting requirements for Hellenic Coast Guard inspections, classification society surveys, and flag state audits. KPI dashboards support compliance reporting by automatically generating documentation showing systematic maintenance programs, tracking corrective action closure from previous inspections, demonstrating continuous improvement trends in safety and environmental performance, and providing audit trails connecting maintenance activities to regulatory requirements. Marine Inspection's platform includes Greece-specific reporting templates matching Hellenic Coast Guard documentation standards, classification society survey preparation reports, ISM Code compliance summaries, and PSC deficiency trending analysis. Greek fleet managers report 100% audit readiness and 70% reduction in compliance documentation preparation time through automated reporting versus manual compilation from multiple data sources.
Modernize Greek Fleet Performance Management with KPI Dashboards
Marine Inspection provides real-time KPI dashboards, automated reporting, predictive analytics, and fleet benchmarking designed for Greek maritime operational requirements. Join 280+ fleet managers transforming maintenance data into strategic performance insights.
Conclusion: Data-Driven Fleet Management for Greek Maritime Operations
Greek fleet maintenance KPI dashboards demonstrate that effective performance management requires transforming vast maintenance data into actionable insights through systematic analytics, visual presentation, and automated reporting. Greek fleet managers achieving operational excellence implement integrated platforms providing real-time performance visibility, predictive analytics identifying developing issues, automated reporting reducing administrative burden, and fleet benchmarking revealing optimization opportunities. As Greek maritime industry faces intensifying competition and regulatory requirements, data-driven decision-making becomes competitive differentiator separating high-performing fleets from industry average. Greek fleet managers ready to implement KPI dashboard platform—see demo can leverage Marine Inspection's analytics system designed for complexity Greek fleets face across cargo shipping, tanker operations, and specialized maritime services requiring comprehensive performance monitoring and continuous improvement management.
Frequently Asked Questions
What KPIs should Greek fleet managers prioritize when implementing first maintenance dashboard?
Start with five essential KPIs providing immediate value: (1) unplanned downtime hours per vessel per month showing reliability performance, (2) preventive versus corrective maintenance ratio revealing whether maintenance program proactive (target 70/30) or reactive, (3) maintenance cost per operating day enabling vessel benchmarking against fleet average, (4) certificates expiring within 90 days preventing compliance incidents, and (5) critical spare parts stockout incidents showing inventory effectiveness. These metrics provide comprehensive performance overview without overwhelming users with excessive data. Greek fleet managers report these five KPIs deliver 80% of total dashboard value while requiring minimal implementation effort.
How does real-time KPI dashboard improve decision-making speed versus monthly Excel reports?
Monthly Excel reports create 30-45 day decision delay: data collected throughout month, compiled week after month-end, distributed to management week later, decisions made week after that—meaning problems from early month addressed 6-8 weeks after occurrence. Real-time dashboards eliminate this delay by providing current performance visibility updated hourly enabling immediate intervention. Example: dashboard alerts fleet manager that Vessel A experiencing elevated generator failures (3 incidents in 10 days versus fleet average 1 per month), triggering immediate investigation revealing fuel contamination issue addressable within days versus discovering problem 6 weeks later in monthly report after additional failures and costly emergency repairs. Greek operators report 85% faster decision-making with real-time dashboards.
What automated reports does Marine Inspection platform generate for Greek maritime regulatory compliance?
Platform generates Greece-specific compliance reports: (1) Hellenic Coast Guard inspection preparation reports showing maintenance program documentation, safety equipment testing records, and crew training compliance, (2) Classification society survey preparation reports documenting equipment maintenance history and outstanding work items, (3) ISM Code audit summaries demonstrating systematic safety management with maintenance procedure compliance and non-conformity tracking, (4) PSC deficiency trending analysis showing historical inspection results and corrective action implementation, and (5) Flag state annual reports documenting vessel maintenance activities for flag administration requirements. These templates match Greek regulatory documentation standards reducing preparation time 70% versus manual compilation while ensuring consistent presentation across fleet.
How does fleet benchmarking identify specific improvement opportunities for underperforming vessels?
Benchmarking compares individual vessel KPIs against fleet averages revealing performance gaps: Vessel experiencing maintenance costs 30% above fleet average triggers investigation revealing excessive corrective maintenance due to deferred preventive work—corrective action implements stricter preventive maintenance adherence reducing costs to fleet average within 3 months. Sister ship comparison shows one vessel achieving 4,500 operating hours between main engine overhauls while identical vessel averaging 3,200 hours—investigation reveals superior fuel quality management and oil analysis program transferable to underperforming vessel. Greek fleet managers report benchmarking identifies specific, actionable improvements versus vague "do better" directives, with documented cost reductions averaging 18-25% for vessels previously performing below fleet average.
How does Marine Inspection's platform specifically address Greek fleet operational complexity across multi-flag vessels?
Greek operators managing vessels under different flags (Greek, Liberian, Maltese, Panama) face varying regulatory requirements and reporting standards. Marine Inspection provides: (1) flag-specific compliance KPIs tracking requirements unique to each administration, (2) multi-currency cost reporting supporting vessels operating different expense currencies with consolidated fleet-wide analysis, (3) customizable dashboards enabling Greek-language interface for local teams and English for international stakeholders, (4) classification society-specific survey tracking accommodating different class requirements (Lloyd's Register, DNV, ABS, Bureau Veritas), and (5) regulatory report templates matching each flag state's documentation standards. Greek fleet managers report unified performance visibility across multi-flag operations versus previous fragmented systems requiring separate tracking per flag state.