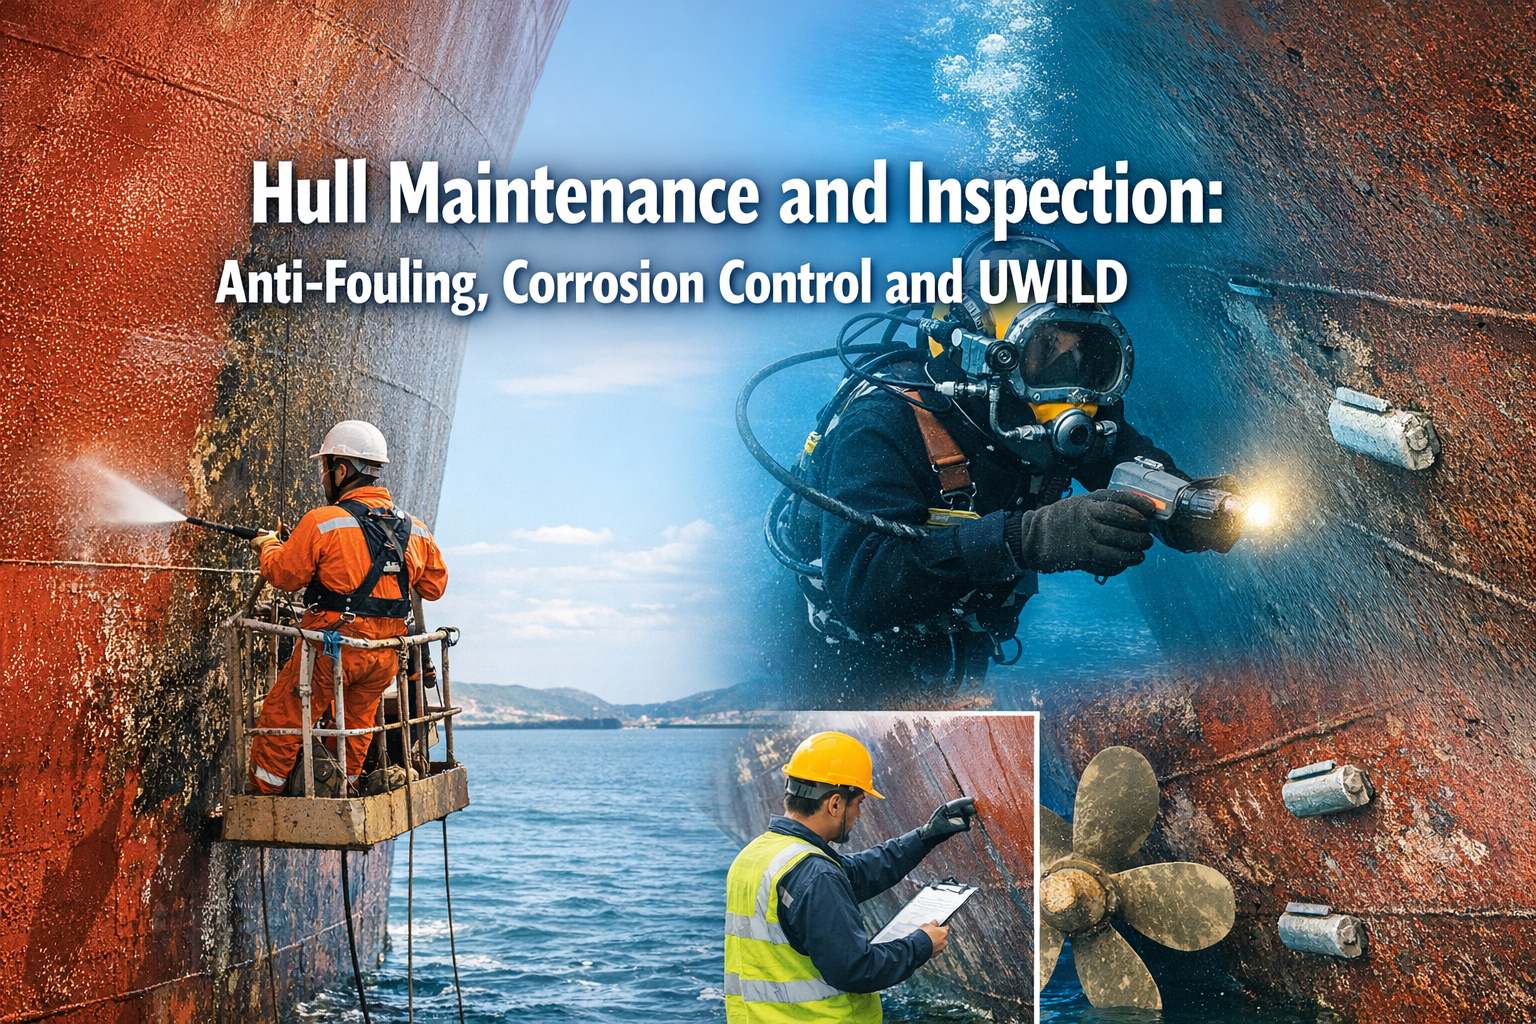
Hull Maintenance and Inspection: Anti-Fouling, Corrosion Control and UWILD
A vessel's hull is its largest single asset — and its most financially consequential maintenance challenge. Industry data shows that even light biofouling can increase fuel consumption by 25%, while heavy calcareous growth drives that penalty to 40%. With fuel representing up to 60% of total operating costs, and a 10-micron increase in average hull roughness translating to a 1% fuel consumption increase, hull maintenance is not a cosmetic exercise — it is the single most impactful operational expenditure decision a superintendent or naval architect can make. Beyond fuel economics, hull condition directly affects CII ratings, classification survey outcomes, UWILD eligibility, and the EU ETS carbon cost exposure that took effect in 2024. Niche areas like rudders, sea chests, and propellers represent less than 10% of total hull surface but can contribute nearly 30% of hydrodynamic drag when fouled. Superintendents and naval architects building systematic hull management programmes can start a free trial of Marine Inspection to digitalise hull condition tracking, coating records, and cathodic protection monitoring across the fleet.
25-40%
Fuel Penalty from Fouling
Light slime to heavy calcareous growth
~60%
Fuel as % of OpEx
Hull condition is the largest controllable fuel variable
$5-15K
UWILD Cost (2026)
vs. $500K-2M+ for full drydocking
30%
Drag from Niche Areas
Rudder, sea chests, propeller — only 10% of hull surface
The Three Pillars of Hull Protection
Hull protection is a three-layer system where each component supports the others. Coating failure exposes steel to seawater. Cathodic protection compensates where coating has deteriorated. And biofouling management prevents the marine growth that degrades both coating and hydrodynamic performance. When any one layer fails, the other two compensate — but at increased cost and reduced effectiveness.
1. Anti-Fouling Coating Systems
Types
Self-polishing copolymer (SPC) coatings release biocide as the surface erodes, maintaining a smooth hull over time. Foul-release (silicone/fluoropolymer) coatings create a low-friction surface that prevents organism attachment. Hard anti-fouling paints use contact biocides for static or slow-moving vessels.
Key Considerations
Coating selection depends on vessel speed profile, trading pattern (warm vs cold water), idle time, and drydock interval. SPC coatings suit active trading vessels. Foul-release suits high-speed vessels with short idle periods. IMO AFS Convention bans TBT-based systems; copper-free alternatives are increasingly required in sensitive waters.
Failure Indicators
Osmotic blistering, mechanical damage (tug impact, anchor chain abrasion), premature polishing, coating delamination, and excessive roughness measured during underwater inspection.
2. Cathodic Protection (CP)
Types
Sacrificial anode systems (SACP) use zinc or aluminium anodes that corrode preferentially, protecting the hull steel. Impressed current cathodic protection (ICCP) uses powered anodes to maintain protective electrical potential across the hull — more controllable but complex.
Key Considerations
Anode depletion rate indicates coating effectiveness — if anodes show 70%+ wastage within a single year, it signals coating failure or electrical imbalance. CP potential measurements during UWILD surveys verify protection thresholds. Bare metal components (propellers, bearings, external coolers) rely entirely on CP when uncoated.
Monitoring
Measure electrochemical potential at multiple hull locations during every underwater survey. Record anode wastage percentages. Identify under-protected zones. For ICCP systems, monitor current output and reference electrode readings continuously.
3. Biofouling Management
IMO Framework
IMO Biofouling Guidelines (Resolution MEPC.207(62)) recommend vessels maintain a Biofouling Management Plan and Biofouling Record Book. 2026 updates strengthen these guidelines with enhanced inspection and management expectations. Biofouling is also a biosecurity risk — introducing invasive species to new environments.
Operational Management
Regular underwater inspection monitors fouling progression. In-water cleaning (reactive or proactive) removes growth before it becomes calcareous. Niche area management targets sea chests, gratings, rudder, propeller, and rope guards — the areas where fouling clusters most densely and causes disproportionate drag.
UWILD: Underwater Inspection in Lieu of Drydocking
UWILD is the approved alternative to drydocking for intermediate hull surveys — allowing vessel operators to maintain class while avoiding the cost, scheduling constraints, and off-hire time of a full drydock. In 2025, EM&I completed the first fully diverless UWILD achieving class acceptance using only ROV technology. UWILD costs typically range from $5,000-$15,000 in 2026, compared to $500,000-$2,000,000+ for full drydocking. Sign up for Marine Inspection to track UWILD scheduling, documentation requirements, and condition records across your fleet.
All above plus coating renewal, steel repair, valve overhaul
Thickness Measurement
UT gauging by ROV probe (without removing coating)
Full hull thickness measurement programme
Cathodic Protection
CP potential measurement and anode assessment
Full anode replacement and ICCP system overhaul
Coating Work
Limited — no coating renewal possible in-water
Full blast and re-coat capability
Eligibility
Class approval required; typically <15 years; cannot be two consecutive UWILDs
Required at least every other survey cycle
Documentation Required
Docking Plan, Shell Expansion Plan, previous two survey records
Full survey documentation suite
Visibility Requirement
Minimum 2-3 metres underwater visibility
N/A — vessel is in dry dock
Class Acceptance (2026)
ABS, DNV, LR, BV all accept ROV-led UWILD with HD video
Standard class requirement
Costs vary by vessel size, location, and class requirements. UWILD cannot replace every drydock — at least every other bottom survey must be a full drydocking.
Track Hull Condition from Coating to CII Rating
Marine Inspection connects underwater survey records, coating condition data, cathodic protection measurements, and hull cleaning history into one platform — giving superintendents full visibility into the hull factor that drives fuel cost, emissions rating, and classification compliance.
Hull Performance Monitoring: The Data-Driven Approach
Hull performance monitoring transforms hull maintenance from a calendar-based activity into a data-driven operational discipline. By tracking speed-power-draft relationships against a clean-hull baseline, operators can precisely quantify fouling impact, time cleaning interventions for maximum ROI, and demonstrate CII improvement to regulators and charterers.
Speed-Power Analysis
Compare actual fuel consumption against theoretical clean-hull performance at the same speed, draft, and sea conditions. A 5% speed loss at constant power indicates fouling warranting intervention. Continuous monitoring identifies the optimal cleaning window.
Hull Roughness Tracking
Measure Average Hull Roughness (AHR) during drydock surveys using hull roughness gauges. Track AHR progression over the class period. Each 10-micron increase in AHR equals approximately 1% fuel consumption increase. New coating target: AHR below 150 microns.
CII Impact Assessment
Hull fouling directly increases CO2 emissions per transport work — degrading your vessel's Carbon Intensity Indicator rating. A clean hull can improve CII by one letter grade. With EU ETS carbon costs and FuelEU Maritime requirements, hull performance is now a direct financial variable.
Cleaning ROI Calculation
Compare in-water cleaning cost ($10,000-50,000 depending on vessel size) against the fuel savings from restored hull performance. Typical payback period: 2-4 weeks of trading at restored efficiency. Document cleaning effectiveness with before/after underwater survey photos.
Expert Review: Hull Management as a Commercial Strategy
Industry Analysis
Hull management has evolved from a maintenance discipline into a commercial strategy. The convergence of EU ETS carbon pricing, FuelEU Maritime GHG intensity requirements, IMO CII ratings, and rising bunker costs has transformed hull condition from an engineering concern into a boardroom decision. A vessel with a clean, well-maintained hull operates with lower fuel consumption, better CII ratings, reduced EU ETS allowance costs, and stronger commercial positioning with charterers who increasingly require environmental performance evidence.
The 2025 milestone of fully diverless UWILD — achieving class acceptance without divers, work-class ROVs, or DSVs — signals the direction of hull inspection technology. Combined with AI-powered coating condition analysis, IoT-enabled cathodic protection monitoring, and digital twin hull models that predict fouling progression, the hull management systems of 2026 are unrecognisable from the calendar-based drydock schedules of a decade ago. For superintendents and naval architects, the competitive advantage lies in integrating these technologies into a unified hull performance management programme that connects underwater survey data, coating records, CP measurements, fuel consumption trends, and CII tracking into one actionable system. Schedule a walkthrough to see how Marine Inspection connects hull maintenance with fleet-wide performance management.
Conclusion
Hull maintenance is the single most financially impactful maintenance discipline for any commercial vessel. With fouling penalties of 25-40% on fuel consumption, fuel representing 60% of operating costs, and hull condition directly affecting CII ratings, EU ETS exposure, and classification compliance, the operators who manage hull condition systematically gain measurable commercial advantage over those who treat it as a drydock-interval exercise. The three pillars — anti-fouling coatings, cathodic protection, and biofouling management — must work as an integrated system, monitored through regular underwater surveys (including UWILD at $5,000-15,000 versus full drydocking at $500,000-2,000,000+) and hull performance analysis that quantifies the return on every maintenance intervention. Marine Inspection provides the digital platform that connects these hull management elements into one system — sign up today to take control of your fleet's hull performance.
Frequently Asked Questions
What is UWILD and when can it replace drydocking?
UWILD (Underwater Inspection in Lieu of Drydocking) is an approved alternative to drydocking for intermediate hull surveys. It allows operators to maintain class while the vessel remains afloat, using divers or ROVs to inspect the hull, propeller, rudder, sea chests, anodes, and through-hull fittings. UWILD requires class society approval, typically applies to vessels under 15 years old, and cannot be conducted as two consecutive surveys — at least every other bottom survey must be a full drydocking. In 2026, UWILD costs $5,000-15,000 versus $500,000-2,000,000+ for full drydocking. Most IACS class societies now accept ROV-led UWILD with HD video.
How does hull fouling affect fuel consumption?
Hull fouling increases hydrodynamic drag, forcing the engine to work harder to maintain speed. Light slime fouling can increase fuel consumption by approximately 25%, while heavy calcareous growth (barnacles, tube worms) can increase it by up to 40%. Every 10-micron increase in average hull roughness translates to approximately 1% fuel consumption increase. With fuel representing up to 60% of total operating costs, hull condition is the single largest controllable variable in vessel operating economics. Niche areas (rudder, sea chests, propeller) represent less than 10% of hull surface but can contribute nearly 30% of total drag when fouled.
What documentation is required for a UWILD inspection?
Shipowners must submit a Docking Plan, Shell Expansion Plan, and records from the previous two underwater surveys to the attending class surveyor before commencing the UWILD inspection. The application must be submitted at least 90 days before the next required drydock examination (USCG vessels). The inspection generates detailed reports with annotated photographs or video frames showing defect locations referenced to vessel drawings, measurement data from thickness gauging, cathodic protection potential readings, and comparative analysis with previous inspection results.
What are the types of anti-fouling coating systems?
Three main types: Self-polishing copolymer (SPC) coatings release biocide as the surface erodes, maintaining smoothness over time — best for active trading vessels. Foul-release coatings (silicone/fluoropolymer) create a low-friction surface preventing organism attachment — best for high-speed vessels. Hard anti-fouling paints use contact biocides — suited for static or slow-moving vessels. The IMO AFS Convention bans TBT-based systems, and copper-free alternatives are increasingly required in environmentally sensitive waters.
How does hull condition affect CII ratings?
Hull fouling directly increases CO2 emissions per unit of transport work — the core metric of the Carbon Intensity Indicator. A fouled hull requires more fuel to maintain the same speed, producing more emissions per ton-mile of cargo carried. This degrades the vessel's CII rating, potentially moving it from a C to a D or E rating, which triggers corrective action requirements. A clean hull can improve CII by one full letter grade. With EU ETS carbon costs applying to maritime from 2024, and FuelEU Maritime GHG intensity requirements from 2025, hull condition is now a direct financial variable in emissions compliance.
Master Your Fleet's Hull Performance
From coating condition tracking to UWILD scheduling, cathodic protection monitoring to CII impact analysis — Marine Inspection connects every element of hull management into one platform built for superintendents and naval architects who understand that hull condition is the largest controllable variable in vessel operating economics.