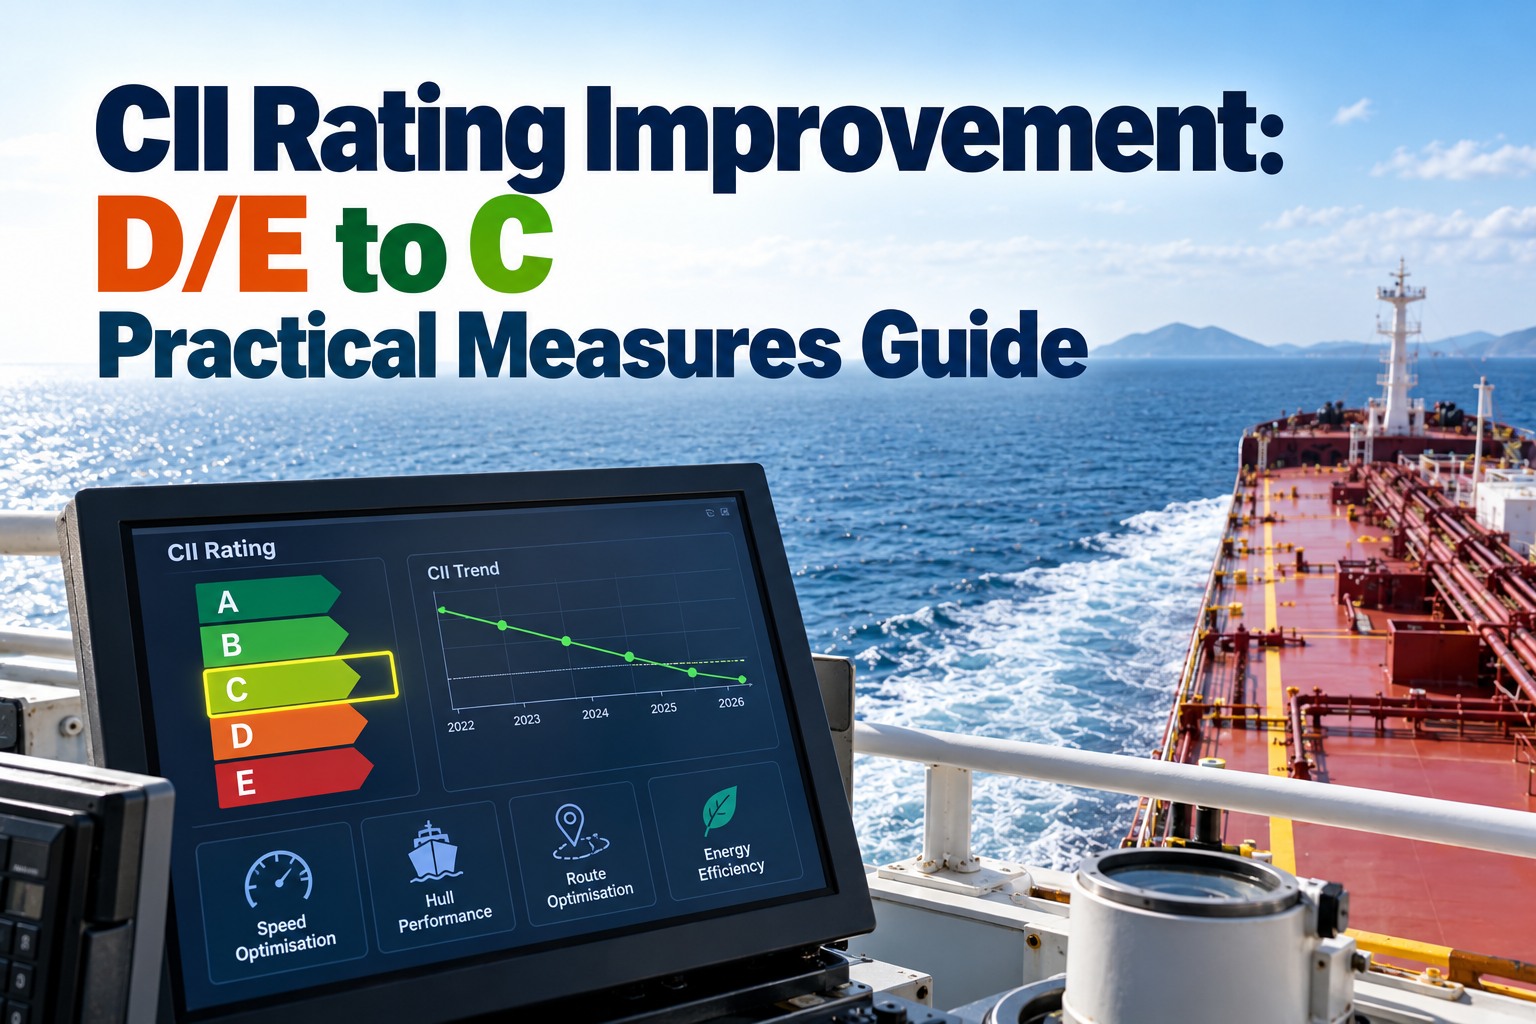
A D or E rating is more than a compliance flag: charterers screen for it, and three Ds in a row or one E forces a corrective action plan. Getting back to C starts with knowing the exact gap, then picking the measures that close it fastest. This guide shows how to size the gap, where the CO2 really goes, and which measures move the number. Book a demo to track CII measures.
CII rating improvement: from D or E back to C, with measures you can prove
Ratings are set against a required CII that tightens every year. Standing still means sliding down.
Bulk carrier bands, shown as attained ÷ required CII. Example ship at 1.12.
Why a CII D rating or E rating matters in 2026
A D or E is common, but it is not a safe place to stay. Charter parties increasingly carry CII clauses, and the regulation itself requires action. Our overview of how CII works and the main measures covers the basics; this page is the recovery playbook. Try the platform free.
Required reduction below the 2019 reference line (Z factor)
CII calculation: size the gap to C before choosing measures
For most cargo ships the attained CII is the annual efficiency ratio: CO2 emitted divided by deadweight times distance sailed. The rating compares it with the required CII for that year, using fixed band vectors for each ship type.
| Ship type | A/B | B/C | C/D | D/E |
|---|---|---|---|---|
| Bulk carrier | 0.86 | 0.94 | 1.06 | 1.18 |
| Tanker | 0.82 | 0.93 | 1.08 | 1.28 |
| Container ship | 0.83 | 0.94 | 1.07 | 1.19 |
| General cargo | 0.83 | 0.94 | 1.06 | 1.19 |
Worked example: bulk carrier rated D
Values are the boundary vectors from MEPC.354(78), applied as multiples of the required CII. Example is illustrative; use your own verified figures.
Diagnose the CII score: where the CO2 really goes
The attained CII counts every tonne of fuel burned in the year, but only distance sailed earns credit. Fuel burned at anchor, drifting or in port adds CO2 with no distance against it. Split last year’s fuel before choosing measures.
Annual fuel split, example bulk carrier (illustrative)
In this example, nearly one tonne in five earns no distance at all. Halving waiting time alone would improve the attained CII by about 5%.
What owners say drives unfair ratings
Responses in the ICS 2024 CII data collection (MEPC 84/6/13).
Operational CII measures: speed, routing and waiting time
Operational measures work within months and need little or no capital, which makes them the first lever for a D-rated ship. Each needs a clear instruction and records that show it was followed. See measure tracking in a demo.
Speed
Fuel per day rises roughly with the cube of speed, so fuel per mile rises with its square. In theory, 10% slower cuts fuel per mile by about 19%; real savings are lower because auxiliary load continues.
Evidence: speed instructions and noon reportsJust-in-time arrival
Slowing down to arrive when the berth is ready turns waiting fuel into useful, lower-speed sailing. It needs agreement with charterers and port.
Evidence: ETA messages and anchor timeWeather routing
Avoiding heavy weather and using currents reduces fuel per mile, especially on long ocean passages.
Evidence: routing advice and passage planTrim and auxiliaries
Sailing at optimum trim and running only the generators needed trims fuel use without any change to the voyage.
Evidence: trim data and generator logsTurn measures into a rating you can prove
Track every CII measure as a task with an owner, a date and evidence, and see which ships are on course for C.
Technical CII measures: hull, propeller and engine
Hull condition is often the largest hidden penalty. An IMO GloFouling study found that a slime layer just 0.5 mm thick over up to half the hull can raise greenhouse gas emissions by 20–25%. Our guide to hull maintenance and underwater inspection covers the inspection side.
Build the CII corrective action plan
Whether or not a plan is formally required yet, the same structure works: each measure with its expected effect from your own data, cost, time to effect and the evidence that shows it happened. Combined, the effects must exceed the gap you sized above.
| Measure | Cost | Time to effect | Owner | Evidence |
|---|---|---|---|---|
| Speed instruction | Low | Next voyage | Commercial + master | Instructions, noon reports |
| Just-in-time arrival | Low | Next voyage | Commercial | ETA messages, anchor time |
| Hull cleaning and propeller polish | Medium | Weeks | Superintendent | Diver report, before and after photos |
| Trim and generator management | Low | Immediate | Chief officer, chief engineer | Trim log, generator hours |
| Coating or energy-saving device | High | Next docking | Technical manager | Docking specification, sea trial |
Formal plans go into SEEMP Part III and are verified by the flag or its recognised organisation. Expected effects should come from your own performance data, not generic estimates.
CII improvement timeline: 12 months from D to C
The rating is annual, so timing matters. Measures started late in the year have little effect on that year’s figure.
CII corrective action checklist
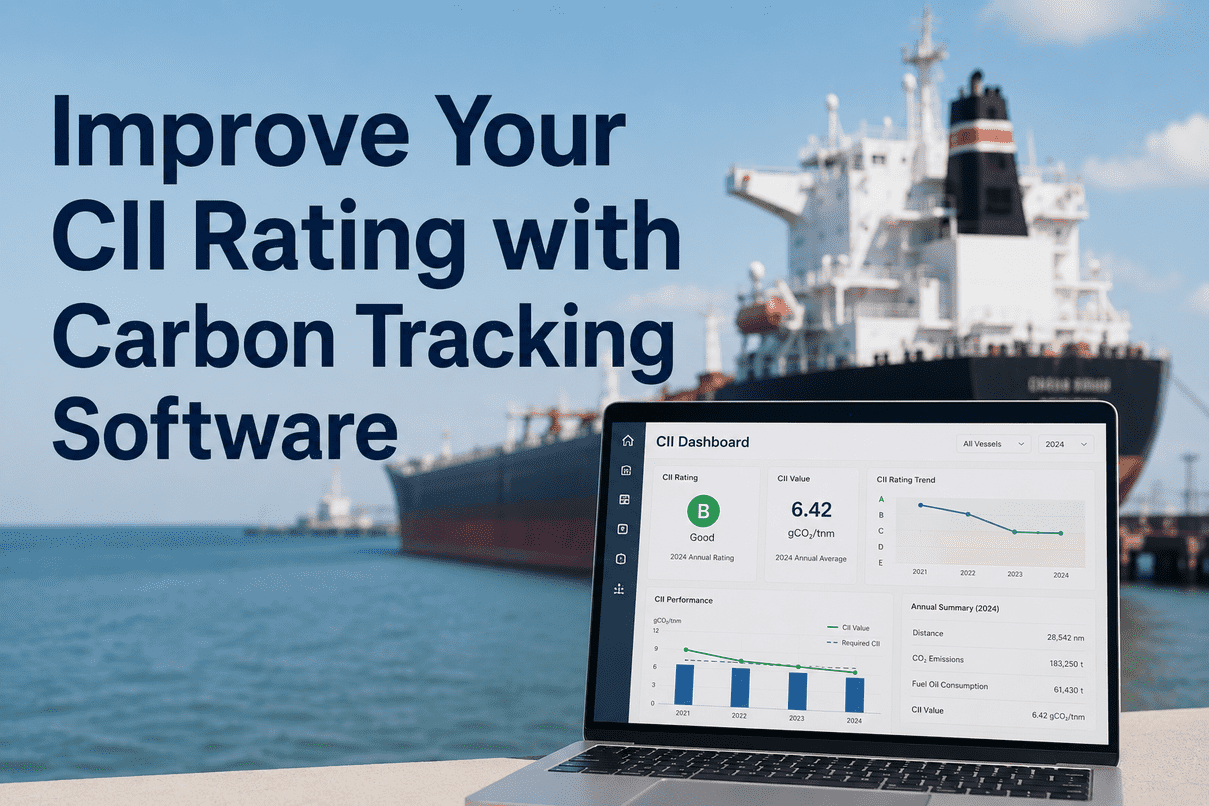
Work through these for each D or E rated ship. For carbon tracking tools, see our guide to CII tracking software.
How Marine Inspection supports CII improvement
CII measures fail quietly when nobody checks they happened. Marine Inspection turns each measure into a tracked action with evidence: hull inspection photos, diver reports, trim checks and speed instructions, all linked to the ship and visible to the superintendent. The tracker below is illustrative.
CII rating improvement FAQs
What happens if a ship gets a CII D or E rating?
A ship rated D for three consecutive years, or E in any one year, must develop a corrective action plan to reach C or better, added to SEEMP Part III and verified.
How much must a D-rated ship improve to reach C?
Enough to fall below next year’s C/D boundary, which moves as the required CII tightens. A bulk carrier at 1.12 needs roughly an 8% cut to reach C in 2027.
What is the fastest way to improve a CII score?
Operational measures: lower speed where the schedule allows, just-in-time arrival to cut waiting, and hull and propeller cleaning when inspections show fouling.
What are the CII reduction factors after 2026?
13.625% for 2027, 16.25% for 2028, 18.875% for 2029 and 21.5% for 2030, below the 2019 reference line, under MEPC.400(83).
Does waiting at anchor hurt the CII rating?
Yes. Fuel burned at anchor counts as CO2 but adds no distance, so long waiting raises the attained CII.
Can Marine Inspection track our CII measures?
Yes. Book a demo to see CII actions tracked with evidence across the fleet.
Size the gap, pick the measures, prove they happened
A D or E rating is recoverable in a year when every measure is planned, owned and evidenced.