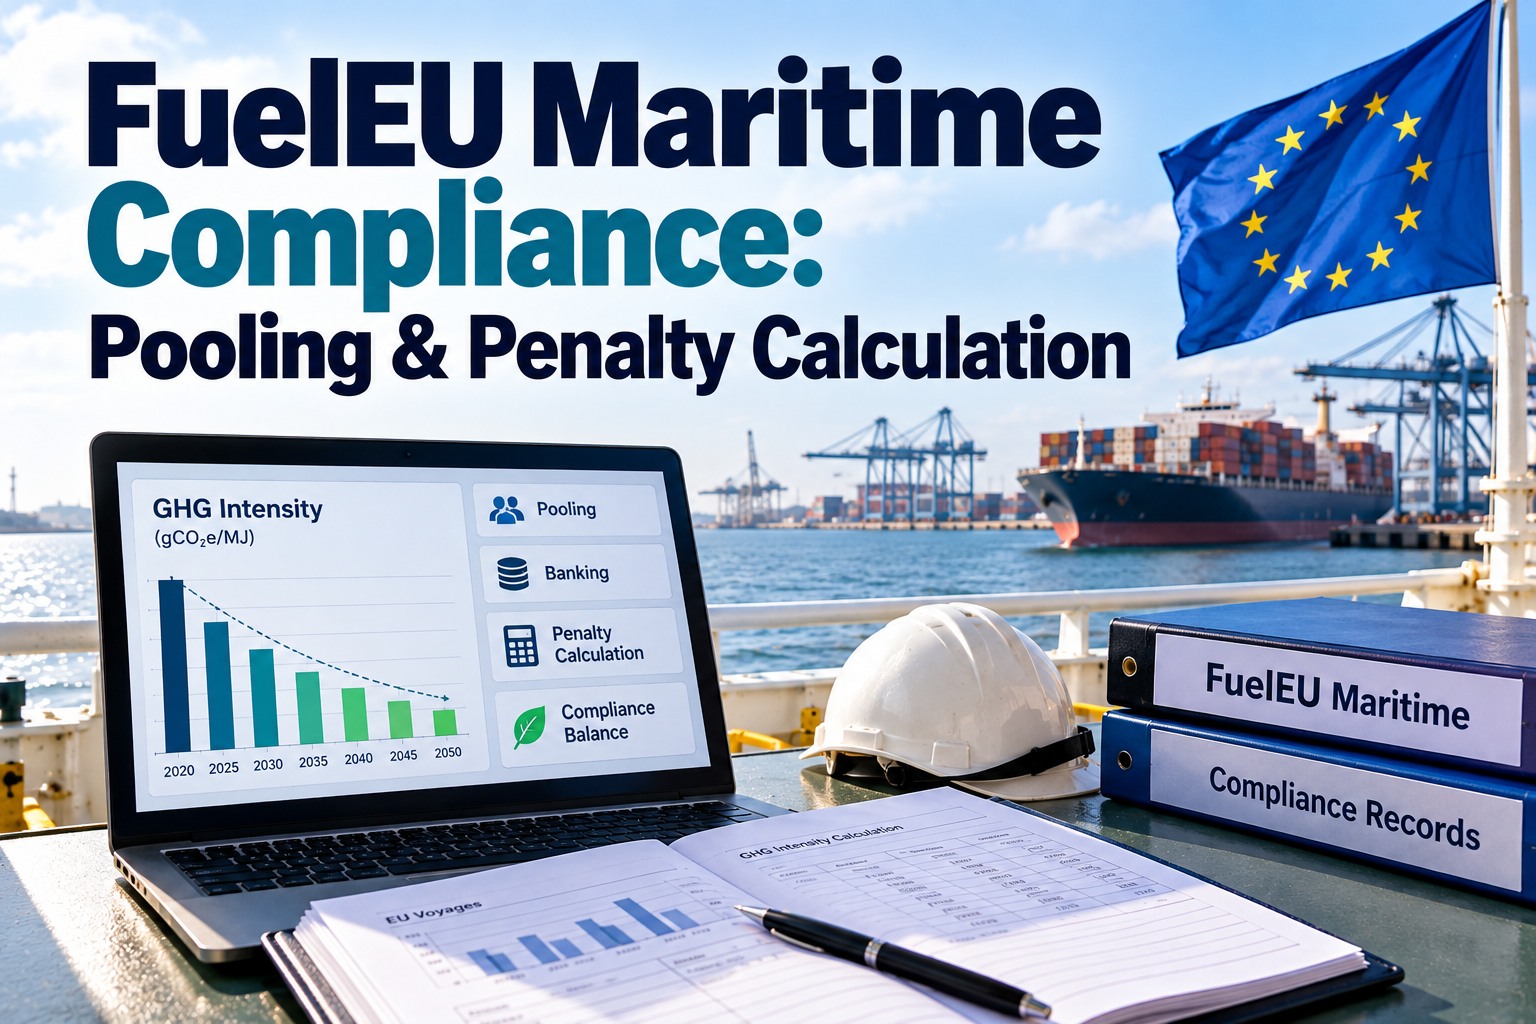
FuelEU Maritime turns every tonne of fuel burned on EU voyages into a number: a compliance balance that is either a surplus to bank or sell, or a deficit to pool, borrow against or pay for. The first compliance year has closed, and pooling has become the default answer. This guide shows how the balance and penalty are calculated, and how pooling and banking change the bill. Book a demo to organise FuelEU evidence.
FuelEU Maritime compliance: GHG intensity targets, pooling and the penalty in real numbers
The target is a well-to-wake GHG intensity limit that tightens every five years from a 2020 reference of 91.16 gCO2e/MJ.
GHG intensity limit, gCO2e/MJ
FuelEU compliance scope: which energy counts
FuelEU applies to ships above 5,000 GT carrying cargo or passengers for commercial purposes, whatever their flag. What counts is energy used on voyages to, from and between EU or EEA ports, and at berth. Our FuelEU Maritime overview covers the background and how it sits next to the EU ETS. Try the platform free.
GHG intensity and the compliance balance: the calculation
The ship’s actual GHG intensity is the weighted well-to-wake emissions of all energy used, including methane slip and nitrous oxide. The compliance balance turns the gap to the target into tonnes of CO2e.
well-to-tank + tank-to-wake emissions of all fuels ÷ total energy, in gCO2e/MJ
Lowered by a reward factor for ships with installed wind-assisted propulsion(target − actual intensity) × energy in scope (MJ)
Positive is a surplus; negative is a deficit, in gCO2eWorked example: a ship burning only VLSFO in 2026 (illustrative)
Illustrative figures. Use the emission factors and lower calorific values verified for your own fuels.
FuelEU penalty calculation, step by step
The penalty converts the deficit into the amount of VLSFO it represents and charges €2,400 per tonne of it. Continuing the example:
Repeat deficits cost more
Article 23 multiplies the penalty by 1 + (n − 1)/10 for n consecutive periods with a deficit. The penalty works out at roughly €640 per tonne of CO2e deficit for a VLSFO ship.
Get the fuel evidence right before the verifier asks
Keep bunker delivery notes, fuel certificates and bunker checks with each ship and voyage, ready for the January report.
FuelEU pooling: the rules and the economics
Pooling lets ships with a surplus offset ships with a deficit, across your own fleet or with other companies. In the first compliance year it became the main route: European Commission data cited by Skuld shows 92% of ships used pooling and only 2% borrowed.
Pooling rules
Cost to cover the 904 t deficit (illustrative)
€208/t is the average first-year surplus price reported by Skuld. Pool prices change; check current market levels.
FuelEU banking and borrowing
Banking and borrowing move a ship’s balance between years. Both are ship-specific and must be recorded by 30 April.
Banking a surplus
Borrowing against next year
FuelEU compliance calendar for each reporting year
Each year’s data runs from 1 January to 31 December, and the compliance work happens in the first half of the next year.
Ways to lower GHG intensity: biofuel, LNG, wind and shore power
Pooling buys time; lowering the ship’s own intensity cuts the bill for good. Each route has its own evidence requirements.
FuelEU compliance checklist
Review this before the January report and again before the 30 April deadline. For tracking emissions tools, see our guide to carbon tracking software.
How Marine Inspection supports FuelEU compliance
FuelEU numbers are only as good as the fuel evidence behind them. Marine Inspection keeps that evidence organised: crew complete bunkering checks on the device, attach BDNs and sustainability certificates, and flag mismatches before they reach the verifier. The board below is illustrative.
FuelEU Maritime pooling and penalty FAQs
How is the FuelEU penalty calculated?
Penalty = |compliance balance| ÷ (actual GHG intensity × 41,000) × €2,400. It is multiplied by 1 + (n − 1)/10 for consecutive years in deficit.
What is the FuelEU GHG intensity target for 2026?
89.34 gCO2e/MJ, which is 2% below the 2020 reference of 91.16. It applies from 2025 to 2029, then falls to 85.69 from 2030.
How does FuelEU pooling work?
Ships combine their balances in a pool registered in the FuelEU database. The total must be zero or positive, and no ship can leave the pool worse off than it entered.
Can a FuelEU surplus be saved for later?
Yes. A surplus can be banked by 30 April; it stays with the ship, does not expire and can be used in later pools.
Which ships does FuelEU Maritime apply to?
Ships above 5,000 GT carrying cargo or passengers commercially, for energy used on EU or EEA voyages and at berth, with 50% of energy counted on voyages to or from non-EU ports.
Can Marine Inspection hold our FuelEU fuel evidence?
Yes. Book a demo to see bunkering checks, BDNs and certificates kept by ship and voyage.
Know your balance before the verifier does
Clean fuel evidence, an early pooling decision and a lower-intensity fuel plan keep FuelEU a cost you control.