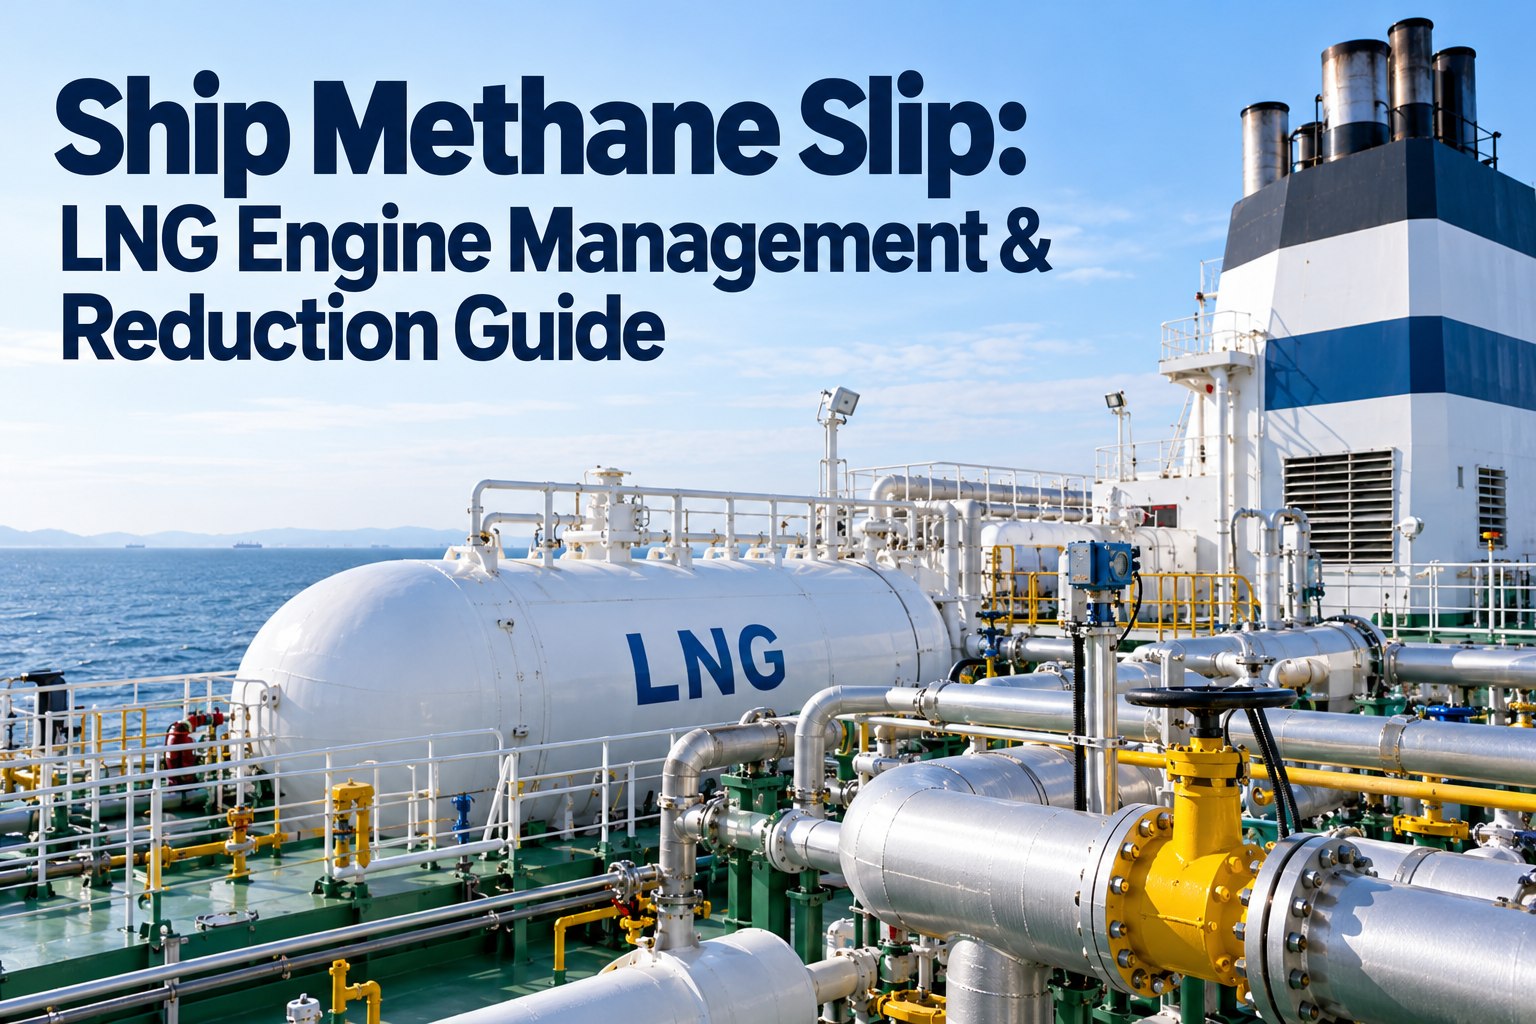
Burning LNG releases less CO2 than burning oil, and that is the case made for it. The case weakens when some of the methane never burns. The unburned share leaves the funnel as methane, a far stronger greenhouse gas than CO2, and under the 2026 rules it is no longer a footnote in the emissions report. How big is the slip on real engines, and what can an engine room do about it? This guide, written for the Chief Engineer, sets out measured figures against defaults, the engine types involved, the measurement route that regulators accept and the levers for reducing slip, with each vendor claim marked as one. For the wider regulation, see our FuelEU Maritime guide to EU shipping emissions compliance in 2026.
What Methane Slip Is and Why a Small Percentage Carries a Large Climate Cost
Unburned methane in the exhaust, and why the multiplier matters
The VTT review frames the problem plainly: LNG has negligible sulphur oxide emissions, can meet the IMO Tier III NOx limit with suitable engine designs and gives lower particulate and CO2 emissions than diesel, but methane slip erodes the climate benefit. Wärtsilä lists the causes as incomplete combustion near cooler zones in the chamber, crevices where unmixed gas escapes burning and valve overlap that lets fresh charge air push gas out of the cylinder. Those causes are the vendor's explanation, but they match the tuning levers discussed later.
Why one gas gets several multipliers
Comparing methane with CO2 depends on the time frame. Our sources quote 25 and 28 for a 100-year view, and more than 80 or 86 for a 20-year view. DNV's article uses 28 for its estimate that standard slip factors can make methane up to 24% of an LNG-fuelled vessel's reported CO2-equivalent emissions. The chart shows the values side by side. The sources do not say which assessment report each number comes from, so confirm which basis applies to the report you are filing.
The LNG Fleet and Its Engines: Where the Slip Comes From
Four engine types, and one of them powers most of the fleet
The VTT review identified the engines on 614 LNG-fuelled vessels. Low-pressure dual-fuel engines, four-stroke or two-stroke, powered 78.1%, high-pressure dual-fuel 14.8% and lean-burn spark-ignited 1.7%. The GreenRay project adds that four-stroke low-pressure dual-fuel engines are common in ferries and cruise ships, and two-stroke low-pressure dual-fuel engines in large cargo ships. Since most slip data comes from low-pressure dual-fuel engines, the fleet's biggest uncertainty sits where most of the engines are.
| Engine type | What the sources say | Source type |
|---|---|---|
| Lean-burn spark-ignited (LBSI) | Slip increases at low loads. About 1.7% of 614 LNG vessels with identified engines | Review and EU project |
| Four-stroke low-pressure dual-fuel (LPDF 4-S) | Common in ferries and cruise ships. ICCT measured 6.4% average on 18 ships against EU 3.1% and IMO 3.5% defaults | Independent study |
| Two-stroke low-pressure dual-fuel (LPDF 2-S) | Common in large cargo ships. Test-bed and on-board results showed reasonable agreement | EU project |
| Two-stroke high-pressure dual-fuel (HPDF 2-S) | Very little slip, but limited data. Diesel-cycle engine | Review and EU project |
| Slow-speed LNG Otto engine | DNV example: default 1.7%, about 0.7% achievable with upgrades | Class society, sells services |
Measured Against Default: What the Studies and Regulators Report
The ICCT plume study on 18 ships and what it means for the default factors
The ICCT FUMES study measured exhaust plumes from LNG ships in Europe and Australia in 2022 using drones and helicopters. For 18 ships with four-stroke low-pressure dual-fuel engines, slip averaged 6.4%, against the EU default of 3.1% and the IMO default of 3.5%. ICCT recommends raising the default to at least 6%. Industry commentary disputed ICCT's approach in at least one published response, which we did not review in full, so treat the 6.4% as one study's result, not a settled fleet average.
Load is the variable the engine room controls
The VTT review says lower loads generally increase slip, and the ICCT study reports about 4% to 7% at 25% load or lower. Lean-burn spark-ignited engines also show higher slip at low loads. For a ferry or a ship spending long periods at low load, the annual result depends heavily on the load profile, which is why the actual-factor route below logs load continuously.
The 2026 Rules: Reporting, Pricing and the Route to a Verified Factor
FuelEU Maritime, EU MRV and EU ETS now all touch methane
DNV reports that FuelEU Maritime applies to ships over 5,000 GT calling at EU ports, that its first reporting period began in 2025 and that slip is reported under EU MRV, with methane inside EU ETS from 2026. Standard factors depend only on the engine's combustion type. The European Commission guideline, based on IMO resolution MEPC.402(83) on test-bed and onboard measurement of methane and nitrous oxide, lets owners use actual values instead of defaults if they are certified through approved procedures. DNV's example is a slow-speed Otto engine, with a standard factor of 1.7% against about 0.7% achievable.
What DNV's savings example does and does not show
DNV says the saving can easily exceed EUR 1 million a year for a 24,000 TEU container ship, but its article does not show the calculation. We cannot confirm that figure, and it will depend on engine type, load, fuel use and carbon price. Treat it as a reason to run your own numbers, not as an expected result. For intensity reporting alongside, see our carbon intensity indicator tracking software.
Reducing Slip: Levers, Their Limits and Who Is Making the Claim
Tuning, load management, catalysts and retrofits
The table lists the levers with the type of evidence behind each. The Wärtsilä figures are the maker's own: dual-fuel slip down 75% over 25 years, 2.8 g/kWh on the 46DF under conditions it says are similar to two studies, and a target of about 1 g/kWh. The ICCT study used 5.5 g/kWh as the average for low-pressure dual-fuel medium-speed engines. Ask your engine maker for measured data for your engine and your operating profile before acting on any of these numbers.
| Lever | What is claimed | Evidence quality |
|---|---|---|
| Combustion chamber design and valve overlap | Fewer cool zones and crevices, shorter valve overlap, adjusted gas admission timing reduce slip | Wärtsilä press release, vendor claim |
| Running at higher, steadier load | Hybridisation lets engines run more steadily at higher loads. ICCT found slip highest at low loads, about 4% to 7% at 25% load or less | Vendor claim plus independent measurement |
| Methane catalyst | DNV says catalysts can almost entirely offset the CO2-equivalent impact of methane, but only measurement can verify it | Class society, sells measurement |
| Retrofit for older engines | Wärtsilä lists retrofit technologies for older engines | Vendor claim, no figures given |
| Measured factor in place of default | Verified actual factor can replace the standard one for FuelEU and EU reporting | European Commission guideline as reported by DNV |
| Hydrogen addition | Under investigation by Wärtsilä. It improves combustion but raises NOx, which may exceed Tier II and III limits | Vendor research item, not a current fix |
An engine-room routine that fits the evidence
Four habits follow from the sources. Know the combustion type and default category for each engine. Log load continuously, so the load profile is visible. Follow the maker's current tuning and valve timing specification. If your default factor looks high for your installation, price a measurement against the carbon cost before deciding. ICCT also reports that large LNG tankers with four-stroke LPDF engines can release 24 to 40 kg of methane per hour while unloading, so slip is not only a sea-going matter.
Methane Slip Readiness Checklist for the Chief Engineer
A checklist with a checkpoint type on each item for audits and desk reviews
Use the checklist before a reporting period closes or before a verifier visit. It is our template built from the sources above.
| Item | What to check | Checkpoint type |
|---|---|---|
| Engine type on record | Combustion type of each LNG engine recorded, matching the default factor category used in reporting | Record |
| Maker's tuning data | Valve timing, gas admission and control settings match the maker's current specification | Record |
| Load profile | Share of running hours at low load reviewed, since slip rises at low load | Record |
| Continuous load logging | Engine load logged and averaged over 30 minute intervals if an actual factor is planned | Test |
| Spot measurement evidence | Measurement report from an accredited party filed where an actual factor is claimed | Record |
| Gas leak and venting checks | Gas detection, vents and bunkering connections checked and logged | Test |
| Catalyst or abatement unit | Condition and operating records reviewed where one is fitted | Visual |
| Reporting match | Slip factor used in MRV, FuelEU and ETS reports traced to a default or a verified statement | Record |
Six Mistakes That Leave Slip Unmanaged or Overstated
What the sources point to, in the order they tend to appear
Systems That Keep Slip Evidence Together Across a Fleet
How a dated photo repository, task ownership and deadlines support methane slip records
A verified slip factor depends on records: the measurement report, the load log, the tuning data and the verifier's statement. Marine Inspection supports a dated photo repository, observations turned into tasks with owners, deadlines and evidence, and certificate and equipment tracking. A dated photo of the catalyst or gas-valve unit, a task to obtain a measurement report with a named owner and a due date, and a tracked list of engine certificates give a Chief Engineer a trail that a verifier can follow. It does not replace the engine maker's instructions or your class society. For comparing LNG with other options, see our alternative marine fuels guide covering LNG, methanol, ammonia and hydrogen.