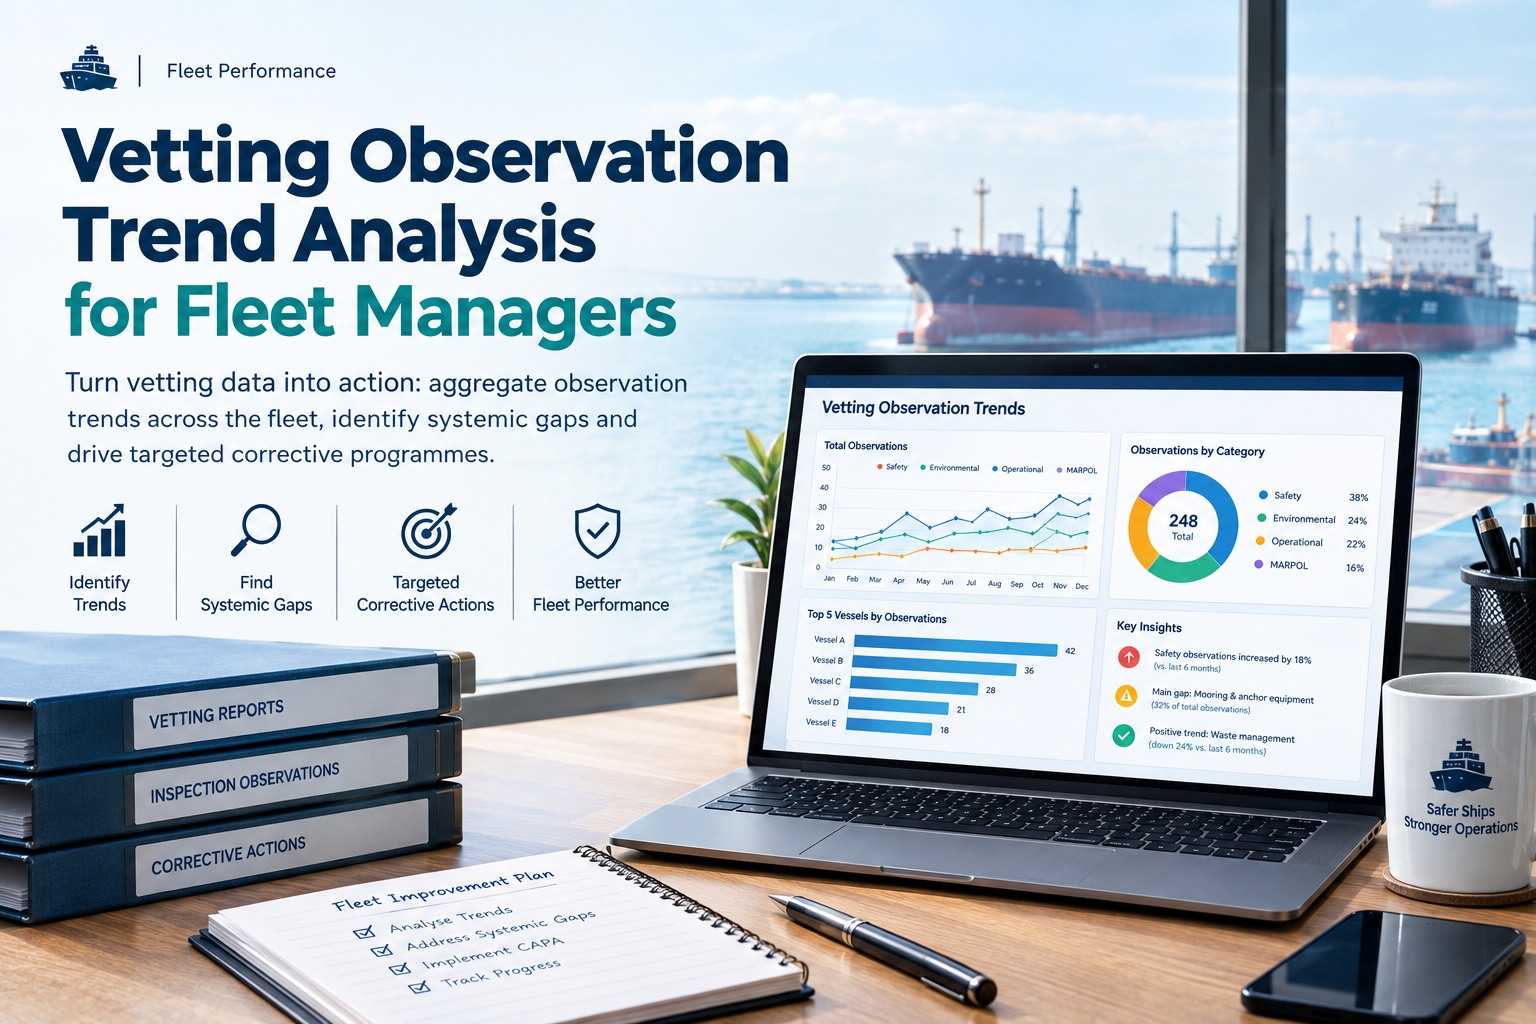
Vetting Observation Trend Analysis for Fleet Managers
A single vetting report is a snapshot of one ship on one day, and almost nobody reads it as anything else. Close the items, file the report, sail. Do that twelve times across a fleet and you have twelve closed reports and no idea that four of your ships were told the same thing about mooring arrangements, or that the lifeboat observation you keep closing has now been raised on six vessels by five different inspectors.
Trend analysis is the discipline of reading the fleet instead of the ship. It is not a dashboard exercise. It is the difference between a department that fixes findings and a department that stops producing them — and in SIRE 2.0, where every observation carries a hardware, process or human-element dimension, the aggregate finally has enough structure to tell you which kind of problem you are actually looking at.
Twelve closed reports is not the same as one answered question
1 report
shows a ship on a day
12 reports
show how the fleet is managed
3 dimensions
decide what the count means
Read the fleet, not the file
Every observation, every vessel, countable from the day it is raised
The structural problem is that reports are closed the way they arrive: one at a time, by the person responsible for that ship, against a deadline set by a charterer. Three features of that workflow actively suppress the fleet view.
Every report is urgent and self-contained
The pressure is to close items before the next fixture, which rewards the narrow fix on this vessel and leaves no moment where anybody asks whether the sister ships have the same arrangement.
The words are never identical
Five inspectors describe the same weakness five ways. Without a common category applied at the point of entry, the aggregate is a pile of free text and the pattern stays invisible to anybody counting.
Closed looks like finished
A closed observation leaves the active list, which is correct for that ship and misleading for the fleet. The item that recurs on six vessels is, by this logic, six closed items and zero open problems.
What makes a gap systemic rather than local
Not every repeat is a systemic gap, and treating them all as one is how fleet programmes lose credibility with superintendents. Four tests separate the two, and an observation needs more than one of them before it earns a fleet response.
01
It appears across vessels, not across visits
The same item three times on one ship is a vessel problem, probably a maintenance or personnel one. The same item once each on five ships is a management system problem, because five crews arrived at the same shortfall independently.
02
It survives different inspectors and ports
A finding raised by one inspector in one terminal may be a local interpretation. The same finding from four inspectors in four countries is not interpretation; it is your standard being below theirs.
03
It recurs after being closed
This is the strongest signal in the dataset. An item closed with evidence and then raised again means the close-out addressed the instance and not the cause, and that failure mode is almost always procedural.
04
The same cause sits under different findings
The hardest to see and the most valuable. Three unrelated-looking observations that all trace back to familiarisation on joining are one gap wearing three costumes, and counting by category alone will never surface it.
The fleet observation heat grid
The single most useful artefact in vetting analytics is unglamorous: vessels down one side, inspection categories across the other, counts in the cells. It takes an afternoon to build and it is read in ten seconds, because the eye finds the dark column and the dark row without being told to.
The two readings do not share a remedy. A dark column is answered with a change to the management system — a procedure rewritten, a standard raised, a fleet circular with an inspection behind it. A dark row is answered on that ship, with attention to its people, its maintenance backlog or the superintendent carrying it. Running the wrong remedy at the other pattern is the commonest waste in fleet vetting work.
Fleet view
A heat grid that builds itself as inspections close
Marine Inspection records every observation against the vessel, the category and the dimension at the point of entry, so the fleet view is a report you run rather than a spreadsheet somebody maintains by hand.
This is where SIRE 2.0 changed what trend analysis can do. Inspections assess hardware, process and the human element, every observation must link to at least one performance influencing factor, and responses are structured so that hardware, process and human factors are answered separately rather than blended into one statement.
Carry that structure into the aggregate and a category count stops being a number and becomes a diagnosis. Forty mooring observations across the fleet is not one finding. It is three, depending on where the weight sits.
An organisation that counts observations by category alone will run a mooring campaign and be surprised when the numbers do not move. An organisation that counts by category and dimension knows whether it is buying ropes, rewriting a procedure or sitting down with the manning agent — and the hardware share is the part that lands back in the planned maintenance system as dated work rather than as a memo.
Fleet vetting metrics worth reporting
Most vetting dashboards report the volume of observations, which is the least informative figure available. These are the measures that change decisions, and the final column is the one to read before anybody puts a target on them.
Measure
How it is worked out
What it tells you
How it misleads
Observations per inspection
Total observations divided by inspections, over a rolling twelve months
The broad direction of fleet condition and preparation
Moves with inspector severity and port mix as much as with your ships
Repeat rate
Observations matching a previously closed item, as a share of the total
Whether close-outs address causes or instances — the single best management signal
Needs consistent categorisation, or genuine repeats hide behind different wording
Fleet spread of a finding
Number of vessels carrying the same category, divided by vessels inspected
Whether a gap is systemic or local — what the dark column measures
Small fleets produce noisy percentages; count vessels, not rates, below ten ships
Dimension mix
Share of observations attributed to hardware, process and human element
Which kind of corrective programme the data is actually asking for
Only as good as the tagging discipline at the point of entry
Time to close
Median days from observation raised to evidence attached
Whether the organisation has capacity to act, or is clearing items on paper
Rewards fast closure, which is exactly how repeat rates are manufactured
Recurrence after closure
Items raised again within twelve months of being closed with evidence
Close-out quality, stated as a number somebody has to own
Low counts early on usually mean a short history, not a strong process
Pre-inspection detection
Share of findings your own inspections caught before a vetting inspector did
Whether internal assurance is calibrated to external expectations
Easy to inflate by logging trivia internally; judge it by category, not volume
Set direction of travel rather than hard targets on these. A target on observation volume teaches people to record fewer observations, which destroys the dataset you built the programme on.
From trend to corrective programme
Analysis that ends in a report changes nothing. The handover from insight to action is where most fleet vetting programmes quietly fail, and it has a shape.
Step 1 · Name the gap in one sentenceNot “mooring issues”. Something closer to “on five vessels, brake holding capacity test records are older than the interval our own procedure sets”. If it cannot be stated that precisely, the analysis is not finished.
Step 2 · Find the cause, dimension firstHardware, process or human. The dimension points at the cause and at who owns it: technical, the management system, or crewing and training. Mixed gaps get separate answers, exactly as the inspection response structure requires.
Step 3 · Fix the system, not the fleet copyA circular telling twelve masters to check something is not a corrective action; it is a transfer of the problem. Changing the procedure, the interval, the checklist or the training is.
Step 4 · Push it to every vessel, including the uninspectedShips that have not been inspected recently are not ships without the gap. They are ships where nobody has looked, and they are where the next observation will be raised.
Step 5 · Verify through your own inspectionsPut the gap into the internal inspection scope for two cycles and count. Verification by the next vetting inspection means waiting six months to learn whether you were right.
Step 6 · Close the loop in the numbersShow the measure moving, by name, in the next review. A programme that cannot show its own effect will not survive the next budget conversation, however sound it was.
A reporting cadence that people actually read
Frequency should follow what can be acted on at each level. More often is not better; it just produces noise that teaches people to skip the attachment.
Monthly
Working level
New observations, items approaching their close-out date, anything raised twice this month. Short, operational, for the superintendents who will act this week.
Quarterly
Management level
The heat grid, the dimension mix, repeat rate and recurrence, with named programmes against the top three gaps and honest movement on the previous quarter’s.
Annual
Board and assurance level
Twelve-month direction, what moved and what did not, how the fleet compares with the previous year, and what the next year’s programmes are. This is also the version a charterer or an assessor will ask to see.
The quarterly pack is the one that does the work, and it belongs alongside the rest of the fleet performance reporting described in our digital transformation roadmap for fleet operators rather than living as a separate vetting artefact nobody outside the department opens.
What goes wrong with vetting trend analysis
Counting before categorising
Free text cannot be aggregated. If the category and dimension are not applied when the observation is logged, no amount of analysis afterwards will recover them, and the first year of data is effectively lost.
Comparing ships that are not comparable
A twenty-year-old vessel in a demanding trade will carry more observations than a new ship on a steady run. Compare like with like, or compare each ship with its own history.
Treating volume as performance
Fewer observations can mean a better fleet or a softer inspection. Read volume alongside repeat rate and dimension mix, never on its own.
Analysis owned by nobody senior
A trend report without an owner who can change a procedure is a newsletter. The gap between knowing and fixing is authority, not information.
Data you cannot get back out
Years of categorised observations are a genuine asset, and worth nothing if they cannot leave the system that holds them — which makes export rights a real question, as set out in our note on data ownership and lock-in.
Starting the history too late
Trend analysis needs twelve months before it says anything reliable. The organisations with useful fleet data are the ones that began categorising when they had no use for it yet.
How much data do I need before trends mean anything?
A rolling twelve months, and enough inspections that a category appearing on several vessels is not coincidence. Below ten ships, count vessels carrying a finding rather than calculating percentages, which swing wildly on small numbers.
What is the difference between a repeat observation and a systemic gap?
A repeat is the same item raised again, usually on the same vessel, and points at close-out quality. A systemic gap appears across several vessels, with different crews and different inspectors, and points at the management system. The same observation can be both.
Why does the hardware, process and human split matter so much?
Because it decides the remedy. SIRE 2.0 assesses hardware, process and the human element, links every observation to at least one performance influencing factor, and requires responses to be answered separately for each dimension. Carried into the aggregate, that split tells you whether a category count is a maintenance problem, a procedure problem or a training and manning problem.
Which single metric is most worth watching?
Repeat rate, with recurrence after closure immediately behind it. Volume moves with inspector severity and trade; repeats are almost entirely within your control, which is what makes them a fair measure of management quality.
Should we set targets on observation numbers?
No. A target on volume teaches people to record less, which quietly destroys the dataset. Set direction of travel on repeat rate, recurrence and the share of findings caught internally before an external inspector raised them.
Who should own fleet trend analysis?
Somebody senior enough to change a procedure, an interval or a training requirement — typically at HSSE or fleet management level. Analysis owned by a coordinator with no authority produces reports rather than corrective programmes.
How do we handle findings on vessels that have not been inspected?
Assume they have the gap until somebody has looked. An uninspected ship is not a clean ship, and the next observation is far more likely to come from the part of the fleet nobody has examined than from the vessel that was just inspected.
Can this be done in a spreadsheet?
For a handful of ships, yes, and starting there beats not starting. It stops scaling at the point where someone has to re-type observations from reports every month, because that is the step that gets skipped first and takes the categorisation discipline with it.
Stop closing the same observation on a different ship
Marine Inspection logs every observation against vessel, category and dimension as it is raised, tracks close-out evidence and recurrence, and gives fleet management the heat grid, the repeat rate and the dimension mix without anybody rebuilding a spreadsheet each quarter.