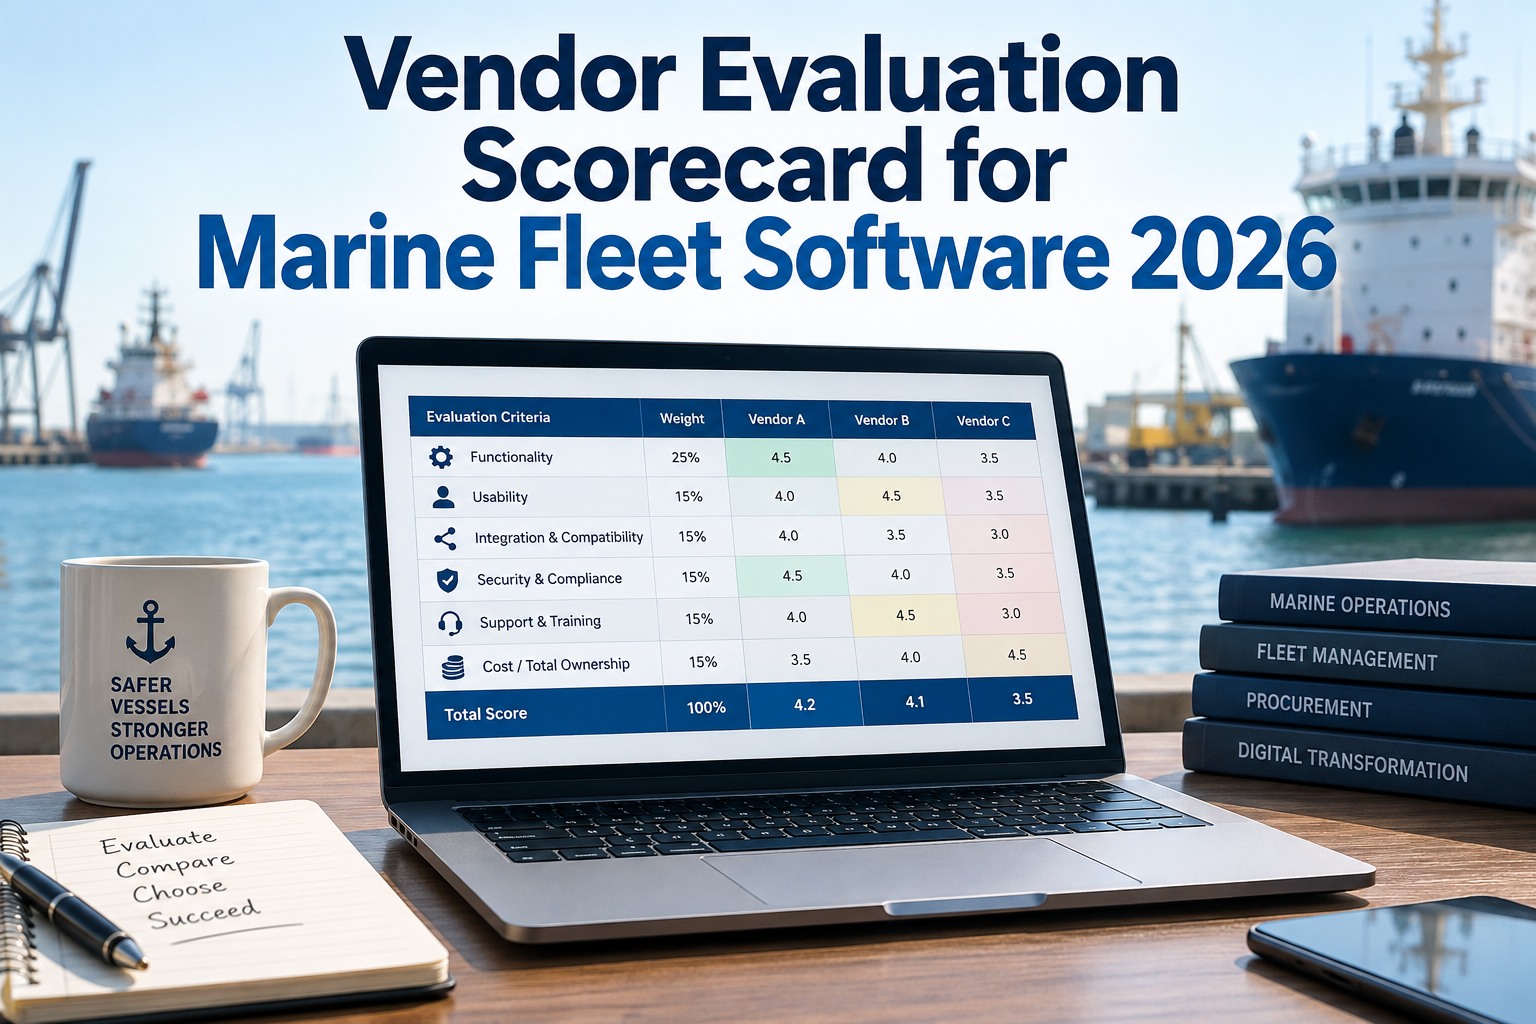
Choosing marine fleet software is rarely hard because the options are poor. It is hard because every option is good at something, the people in the room value different things, and six months later someone asks why the company picked the vendor it did. A weighted scorecard answers that question before it is asked. It sets out what matters, how much each factor counts, what a good score looks like and how cost is compared, and it records how each evaluator scored before the group discussed it. This page gives you a complete scorecard for inspection and maintenance platforms. It covers five weighted criteria, anchored 1-to-5 scales, knockout gates, a five-year cost comparison, a worked example across three vendors and a sensitivity check, so the final decision holds up in front of a board, an auditor or a disappointed bidder. If Marine Inspection is on your list, start a free trial so your evaluators can score the real product, not a slide deck.
The worked example below scores three vendors on the same criteria. The highest total wins only after it survives knockout gates and a check against changed weights.
Run the evaluation in this order
The order matters as much as the criteria. Weights set after proposals arrive tend to follow whichever vendor presented best, and group scoring anchors everyone to the first loud opinion. Agree the rules first, score alone, then talk. If you have not issued an RFP yet, start with our marine fleet software RFP template.
Five criteria and their weights
These weights suit a fleet that trades internationally and faces regular Port State Control and vetting. A coastal operator with strong connectivity might shift points from security and compliance to usability, and a fleet under budget pressure might raise cost. Whatever you choose, the total must be 100 and the weights must be signed off before the first demo.
Each square is one point out of 100.
Anchor every score to something observable
Without anchors, one evaluator's generous 4 is another's strict 3 and the combined score means nothing. A 1-to-5 scale forces people to take a position, and describing what a 1, 3 and 5 look like keeps scores tied to evidence. Scores of 2 and 4 sit between the anchors. Hold a short calibration session on these descriptions before anyone scores.
| Criterion | 1 Fails | 3 Meets | 5 Exceeds |
|---|---|---|---|
| Functionality | Core workflows need custom development | All must-haves covered, some through configuration | All must-haves native, shown on our own data |
| Usability | Crew needed help to finish the scripted task | Task finished with some hesitation | Finished first time, offline, on a phone |
| Support and implementation | No named team, email support in office hours | Named team and plan, support across a few time zones | Named team, dated plan, 24/7 vessel support confirmed by references |
| Security and compliance | No audit trail shown, no approvals evidenced | Audit trail shown, some approvals or documents supplied | Amendment trail shown live, record book approvals and class acceptance evidenced, security documents supplied |
| Cost | Scored by formula, not opinion: 5 × (lowest five-year cost ÷ this vendor's five-year cost) | ||
Knockout gates come before any points
A vendor that fails a must-have should not reach the weighted total, however well it scores elsewhere. Check these five as pass or fail. Most can be tested in a demo using our 20 demo call questions.
Compare cost over five years, not year one
Licence price is the only number vendors quote willingly. Implementation, integrations, training for rotating crews and support tiers change the ranking. Put every vendor's figures on the same five-year basis, then score cost with the formula above. Our hidden costs guide lists what to ask for, and the pricing breakdown guide explains how to normalise quotes.
Illustrative figures. Vendor A's cost score: 5 × (150 ÷ 190) = 3.9.
The completed scorecard
Each score below is the agreed figure after calibration. The weighted column is the score multiplied by the weight. Vendor B is cheapest and wins on cost, but it loses on everything the crew and the auditors will notice.
| Criterion | Weight | Vendor A | Vendor B | Vendor C | |||
|---|---|---|---|---|---|---|---|
| Score | Weighted | Score | Weighted | Score | Weighted | ||
| Functionality | 30% | 4 | 1.20 | 3 | 0.90 | 5 | 1.50 |
| Usability | 15% | 4 | 0.60 | 3 | 0.45 | 3 | 0.45 |
| Support and implementation | 15% | 4 | 0.60 | 3 | 0.45 | 4 | 0.60 |
| Security and compliance | 20% | 5 | 1.00 | 3 | 0.60 | 4 | 0.80 |
| Cost (five-year) | 20% | 3.9 | 0.78 | 5.0 | 1.00 | 3.1 | 0.62 |
| Total | 100% | 4.18 | 3.40 | 3.97 | |||
Check whether the winner survives different weights
When the top two are close, the result may depend more on the weights than on the vendors. A common rule of thumb is to run a sensitivity check whenever the gap is under 10% of the maximum score, which is 0.5 on a 5-point scale. Here the gap is 0.21, so the panel re-ran the totals under three alternative weightings.
Vendor A wins in every scenario, so the decision is robust. The functionality-heavy case narrows the gap to 0.06, which tells the panel exactly what to watch in the pilot: whether Vendor A's functionality holds up on a real ship. Our single-vessel pilot guide covers how to test that.
Record the decision on one page
Keep every evaluator's individual sheet, and summarise the outcome in a short memo. When someone asks in a year why the company chose this platform, the answer is already written down. If the chosen platform replaces a current system, plan the cutover with our guide on switching marine inspection software safely.
Frequently asked questions
Bring your scorecard to a demo, or give your evaluators trial accounts and let them score the product on your own vessel data.