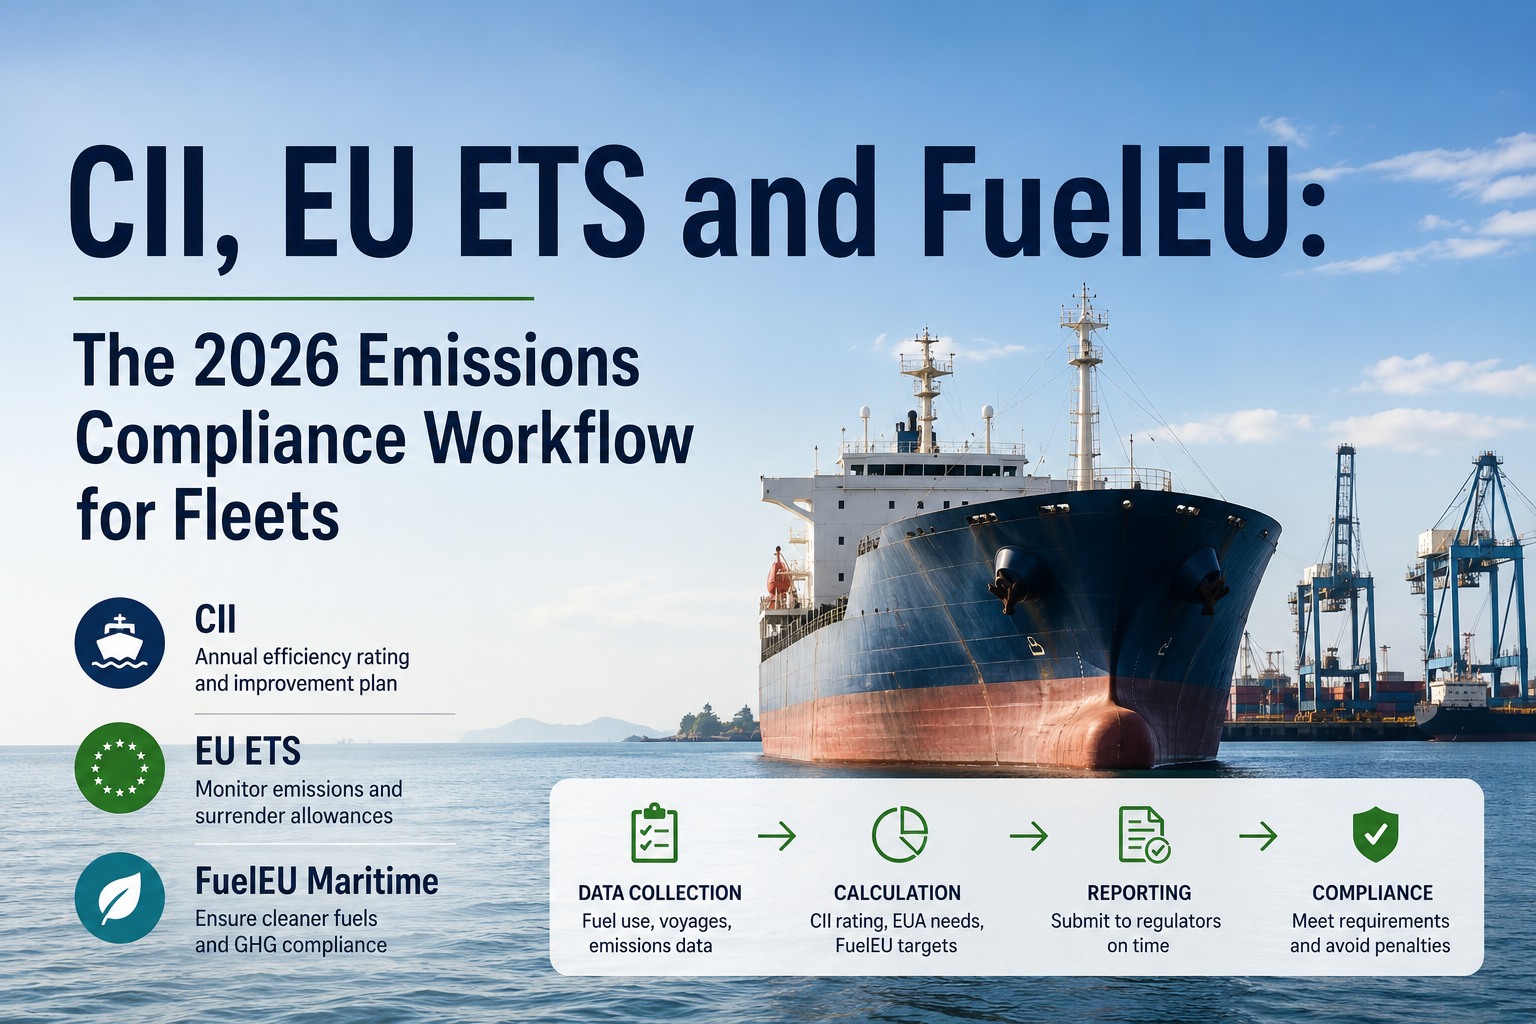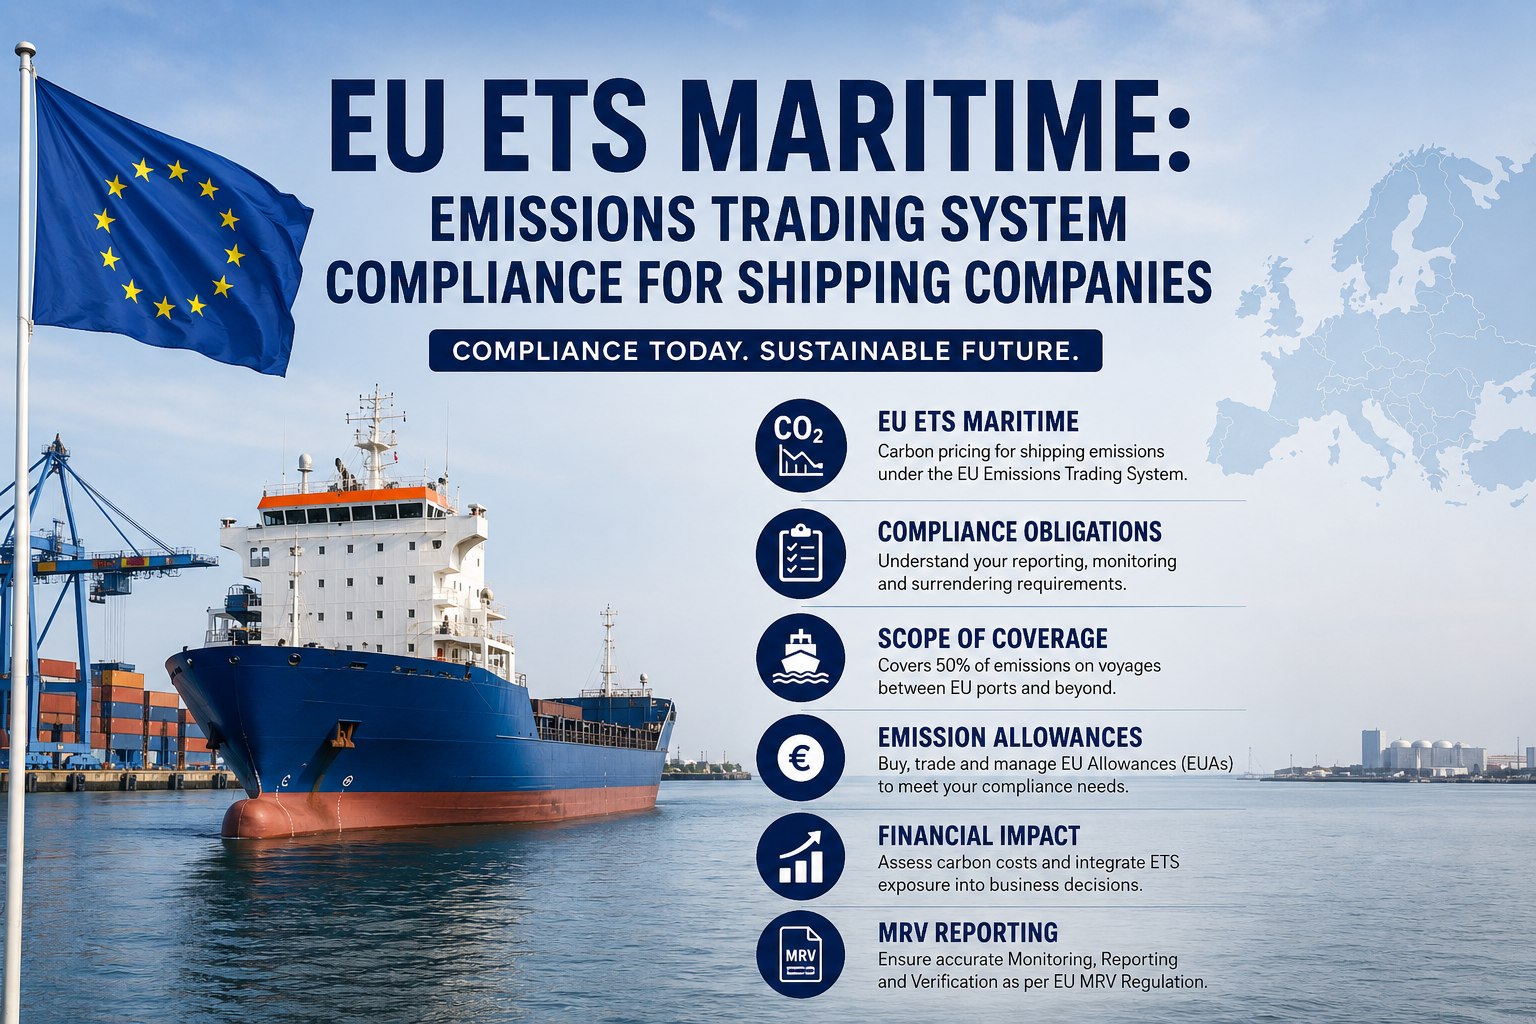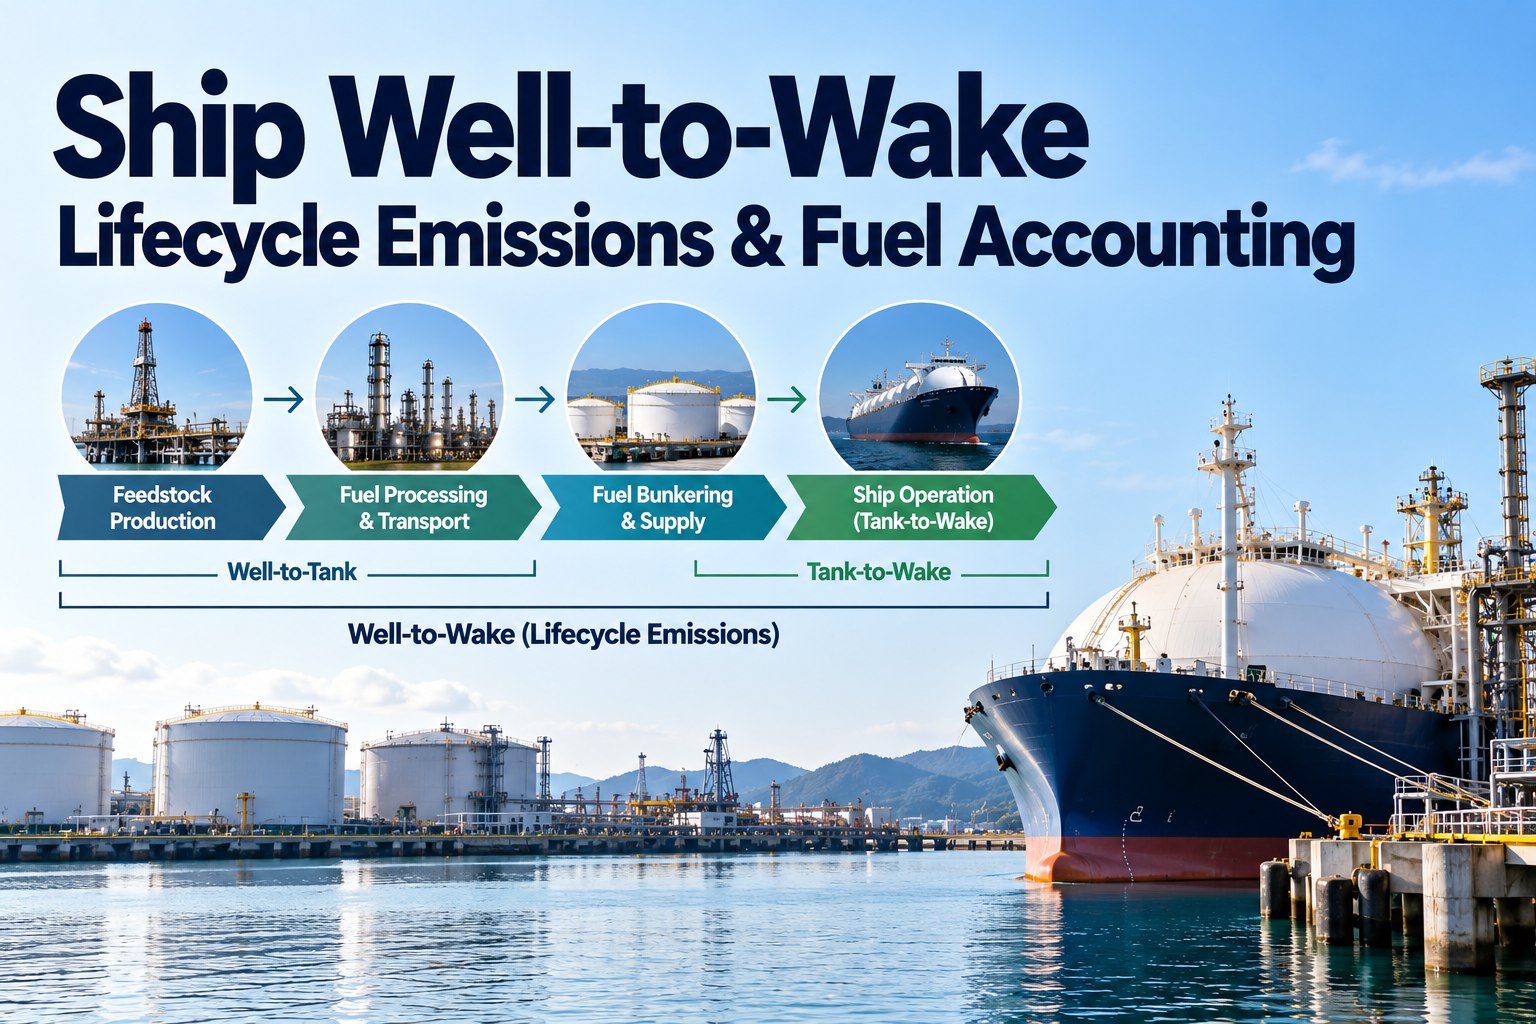
A tonne of fuel does not start its life in the ship's tank. It is produced, processed, shipped and bunkered before a single cylinder fires, and every one of those steps emits greenhouse gas. Regulators now count the whole path, and they call it well-to-wake. What exactly is counted, how is a fuel's value calculated and what does that do to the fuel choice? This guide, written for the Technical Superintendent, explains the two halves of the figure, the gases and conversion factors, how FuelEU Maritime and the IMO guidelines apply them, and the records a ship needs. For the regulation that applies it today, see our FuelEU Maritime guide to EU shipping emissions compliance in 2026.
Two Halves of One Number: Well-to-Tank, Tank-to-Wake and Well-to-Wake
The IMO definitions and why the split matters
The IMO page on its 2024 life cycle guidelines defines well-to-tank as emissions from primary production to carriage of the fuel in a ship's tank, also called upstream. Tank-to-wake runs from the tank to the exhaust, also called downstream. Well-to-wake is the combination, covering the fuel from production to end use by a ship. The guidelines cover carbon dioxide, methane and nitrous oxide. Our worked example below shows why the split matters: for ordinary fuel oil the upstream part is a smaller share, but it is not zero, and for other fuels it can be the dominant part.
Reworking the arithmetic from the published inputs
The Zero Carbon Shipping Center publishes the inputs for its HFO example, and we reproduced the calculation to confirm it. Methane and nitrous oxide are converted to CO2 equivalents using GWP100 factors of 28 and 265, the carbon content is summed and the result is divided by the lower calorific value to convert from grams of fuel to megajoules. The table shows each step. It is one example for one fuel, not a table of fuel values.
| Step | Input or result | Working |
|---|---|---|
| CO2 per gram of fuel | 3.114 g | Given, with a GWP of 1 |
| Methane per gram of fuel | 0.00005 g | 0.00005 x 28 = 0.0014 gCO2eq |
| Nitrous oxide per gram of fuel | 0.00018 g | 0.00018 x 265 = 0.0477 gCO2eq |
| Total per gram of fuel | 3.1631 gCO2eq | 3.114 + 0.0014 + 0.0477 |
| Divide by lower calorific value | 0.0402 MJ per gram | 3.1631 / 0.0402 = 78.68 gCO2eq/MJ |
| Add well-to-tank | 16.8 gCO2eq/MJ | 16.8 + 78.68 = 95.48 gCO2eq/MJ |
How FuelEU Maritime Applies Well-to-Wake Today
A reference value of 91.16 and limits that tighten from 2025 to 2050
DNV says FuelEU limits the yearly average GHG intensity of energy used on board, measured in gCO2e/MJ and set as percentage cuts from a reference value of 91.16. The cuts are 2% in 2025, 6% in 2030, 14.5% in 2035, 31% in 2040, 62% in 2045 and 80% in 2050. Eagle explains that intensity is calculated as the sum of well-to-tank and tank-to-wake, that fossil fuels use the default well-to-tank values from Annex II, and that tank-to-wake defaults can be replaced by certified laboratory or direct measurement, except the fossil CO2 factor.
Certified factors for biofuels and renewable fuels
Biofuels, biogas, renewable fuels of non-biological origin and recycled carbon fuels may use their own well-to-tank values if certified under a scheme the Commission recognises, according to Eagle. DNV adds that fuels meeting the Renewable Energy Directive sustainability and GHG-saving criteria can use certified actual values, while non-sustainable biofuels and food or feed crop biofuels are treated as fossil. We could not reproduce Annex II's per-fuel default numbers from the pages we reached, so check the regulation for the value that applies to your fuel.
The IMO Guidelines: A Framework Whose Defaults Are Still Being Written
What MEPC.391(81) sets up and what is not yet filled in
The 2024 LCA Guidelines, resolution MEPC.391(81), provide a framework for assessing the GHG intensity of marine fuels, introduce a Fuel Lifecycle Label and identify 10 sustainability themes, per the IMO page. The Zero Carbon Shipping Center, a research organisation, adds that the guidelines are based on ISO 14040 and 14044, list 128 fuel and energy carrier pathways of which only three currently have full well-to-wake values, and use representative and conservative assumptions for defaults. Actual factors can be certified if they beat the defaults, fossil pathways cannot use actual well-to-tank values unless they use carbon capture and several parameters remain pending, including direct land-use change, onboard carbon capture credits and fugitive emissions. The IMO page gives April 2024 for MEPC 81 and the explainer says March 2024, so we do not state a day.
Where the IMO Net-Zero Framework stands, as far as the sources go
DNV reports that the extraordinary MEPC session in October 2025 did not adopt the framework: 57 member states voted to adjourn for one year and 49 voted to continue, and DNV notes entry into force would be 1 March 2028 at the earliest. An Italian news report dated May 2026 says the vote was postponed again at MEPC 84, with technical progress on fuel carbon intensity guidelines and a further session scheduled for 4 December 2026, though the same article is not fully consistent on the timeline. The Zero Carbon Shipping Center says guidance linking the Fuel Lifecycle Label to supply chain certificates and bunker delivery notes is expected by MEPC 85. We have not been able to confirm the latest position, so check the current IMO documents before relying on any date.
Why Lifecycle Accounting Changes Fuel Choice, Without Picking a Winner
The same fuel can carry a different footprint, and the funnel is not the whole story
A February 2025 preprint on well-to-tank intensity of high-sulphur fuel oil across 72 countries reports a global volume-weighted average of 12.4 gCO2e/MJ, with upstream values from 1 to 22.7 and refining from 1.2 to 12.6. It also says IMO default values do not differentiate by process, asset or country. The preprint is not peer reviewed, so use it as evidence that the default is an average, not as a rule. The chart shows where the average comes from.
What each fuel family needs on the accounting side
The table pulls the sources together by fuel family. We do not rank fuels, because the sources we reached do not give a full set of comparable numbers, and the right choice depends on engine, route, supply and price. For the practical fuel options, see our alternative marine fuels guide covering LNG, methanol, ammonia and hydrogen.
| Fuel family | What the sources say | What the ship must keep |
|---|---|---|
| Fossil fuels such as HFO, VLSFO and MGO | Use default well-to-tank values from FuelEU Annex II. Tank-to-wake defaults can be replaced by certified lab or direct measurement, but not the fossil CO2 factor | Fuel grade and quantity on the bunker delivery note |
| LNG | Methane slip enters the tank-to-wake side. An unattributed explainer says the result depends on the engine, with Otto-cycle medium-speed engines producing more slip | Engine type and any measured slip data |
| Biofuels and biogas | May use certified actual well-to-tank values if they meet Renewable Energy Directive criteria. Non-sustainable biofuels and food or feed crop biofuels are treated as fossil | Proof of Sustainability and supplier certificates |
| Renewable fuels of non-biological origin | Certified values can be used. Their energy counts double. A 28.2 gCO2e/MJ maximum applies against a 94 comparator (Eagle), meaning at least 70% saving | Certificates and origin documents |
| Blue or fossil-based alternative fuels | Under the IMO guidelines fossil pathways cannot use actual well-to-tank factors unless they use carbon capture | Pathway documentation and certification |
Well-to-Wake Data Readiness Checklist for the Technical Superintendent
A checklist with a checkpoint type on each item for fleet audits and desk reviews
Use the checklist when you set up fuel records for a regime that counts the whole lifecycle. It is our template, built from the sources above.
| Item | What to check | Checkpoint type |
|---|---|---|
| Fuel family per ship | Each ship's fuels listed, with the accounting route that applies to each (default, certified actual or measured) | Record |
| Bunker delivery notes | Grade, quantity and supplier details on the bunker delivery note match the consumption records | Record |
| Sustainability proof | Proof of Sustainability or certificate on file for each biofuel, biogas or renewable fuel claimed | Record |
| Engine type and slip | Engine type recorded for gas-fuelled engines, with any measured slip data filed | Record |
| Measurement evidence | Laboratory or direct measurement reports filed where a default tank-to-wake value is replaced | Record |
| Calculation trail | Intensity calculation reproducible from the records, with the GWP basis stated | Test |
| Fuel tank and meter checks | Meters and soundings behind the consumption figures calibrated and logged | Test |
| Dated evidence | Dated photos of meters, tanks and sample seals for each delivery | Visual |
| Data owner | One named person per vessel owns the fuel data, with a deadline before the verifier's cut-off | Record |
Six Mistakes in Lifecycle Fuel Accounting
What the sources point to, in the order they usually surface
Systems That Keep Fuel Evidence Together Across a Fleet
How a dated photo repository, task ownership and deadlines support fuel accounting
Lifecycle accounting depends on documents that arrive at different times from different parties. Marine Inspection supports a dated photo repository, observations turned into tasks with owners, deadlines and evidence, and certificate and equipment tracking. A tracked certificate for each biofuel delivery, a task for each missing document with a named owner and due date, and dated photos of meters and sample seals give a Technical Superintendent a trail from delivery to calculation. It does not calculate intensity or certify a pathway. For fuel data tools, see our best marine fuel management software for 2026.