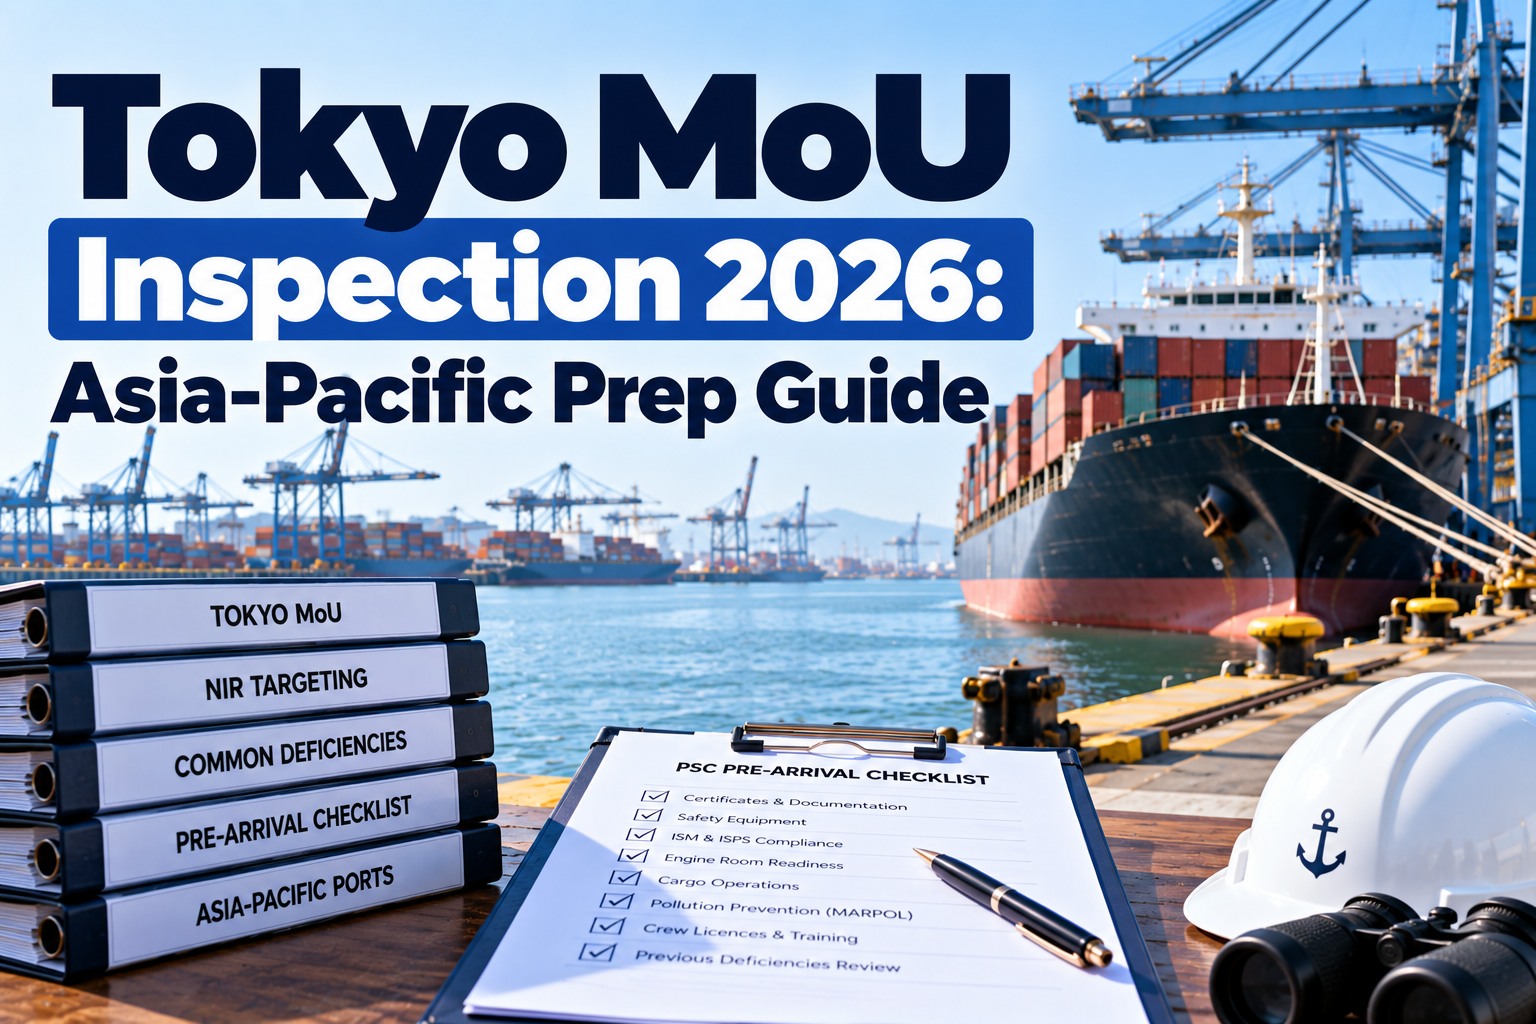
Tokyo MoU Inspection 2026: Asia-Pacific Prep Guide
The Asia-Pacific region runs one rulebook and twenty-two authorities applying it. The chance of being inspected and the chance of being detained are not the same in every port, and the gap between the busiest authority and the strictest one is wide enough to be worth knowing before a vessel is fixed. This guide is about where you call rather than how the regime works: the regional numbers, what the region finds when it looks, and what to do about it on the passage in.
Tokyo MoU · Asia-Pacific port practice
The busiest authority and the strictest one are not the same authority
Know the exposure before the fixture, not after the call
Scale first, because it explains why the Asia-Pacific record dominates most operators’ PSC history whether they think of themselves as trading there or not.
35,546
inspections carried out in the region
19,980
individual ships inspected, under 111 flags
66%
of the roughly 30,046 ships visiting were inspected
3.53%
regional detention rate — 1,255 ships across 73 flags
Two thirds of ships calling in the region were inspected. For a vessel in a regular Asia-Pacific trade, PSC is not an occasional event to prepare for; it is a recurring condition of the business, and the record it produces follows the ship into every other region.
Where the inspections happen
Inspection activity is concentrated. Four authorities account for well over half of everything carried out in the region.
Authority
Inspections
Share of region
Detention rate
What it means for a call
China
9,894
27.83%
6.96%
High volume and high severity together — the single largest source of regional exposure
Japan
4,014
11.29%
—
Heavy inspection activity; expect to be seen on a regular trade
Indonesia
3,736
10.51%
—
Volume comparable to Japan, and often underestimated in planning
Australia
2,769
7.79%
4.80%
Above the regional average on detentions, with a reputation that matches the figure
Singapore
—
—
8.52%
The highest detention rate reported — roughly two and a half times the regional average
Russian Federation
—
—
5.64%
Well above average; worth treating as a higher-risk call than the volume suggests
Republic of Korea
—
—
5.44%
Similar — a busy trading region with a stricter-than-average outcome
Figures are drawn from the Tokyo MoU annual report on port state control in the Asia-Pacific region, which publishes both inspection volumes and detention percentages by Authority. Where a cell is blank the report did not give that figure in the same breakdown, not that the number is zero.
Volume and severity are different things
This is the practical point of the whole page. The authority carrying out the most inspections is not the one most likely to detain, and planning that treats the region as uniform gets both ends wrong.
The probability of being looked at
Driven by volume. China alone accounts for more than a quarter of all inspections in the region, so a China-heavy trade means being inspected often, regardless of how the ship performs.
The probability of being held
Driven by the authority’s own threshold. Singapore reported the highest detention rate at 8.52% — well over double the regional 3.53% — so a smaller number of inspections produces a much higher share of detentions per inspection.
The two compound
China sits high on both measures at 27.83% of inspections and a 6.96% detention rate, which is why Chinese ports deserve separate preparation rather than being folded into a general regional approach — covered in our guide to PSC in Chinese ports.
What the region actually finds
Across 90,168 deficiencies recorded in the reporting period, four categories carry just over half of everything found.
Fire safety, at one in five
The largest single category by a wide margin. Dampers, doors, detection, extinguisher servicing and fixed system condition — the items that are easy to verify and therefore easy to find wrong.
Life-saving appliances, at one in eight
Lifeboat and davit condition, release gear, servicing records and the state of equipment that is inspected rarely and used less.
Working and living conditions, at one in ten
The category technical departments consistently under-prepare, because it is not an engineering problem. Accommodation, food and catering, rest hours and crew documentation sit here.
Safety of navigation, at one in ten
Charts and publications, equipment condition and the bridge as it is actually operated rather than as the procedures describe it.
The third entry deserves attention out of proportion to its position. Working and living conditions is a labour category rather than a technical one, it is examined by people who are looking at the crew as much as the ship, and it sits at ten per cent of everything found in the region — roughly the same weight as navigation.
APCIS: your record arrives before you do
The regional information system is worth understanding because it changes what preparation means. Member Authorities connect to APCIS online or by web service both to search for ships to inspect and to input and transmit their inspection reports, from a central data centre, with the data published on the Tokyo MoU website.
01
It is used to find ships, not just to record them
Authorities search the system to decide which vessels to inspect. Your history is an input to that search before anybody has seen the ship.
02
Reports go in from the port
An inspection in one country is visible to the next one quickly. A deficiency carried forward from a call last month is not a secret at the next port.
03
It is public
The data is published, which means charterers, brokers and anyone else with an interest can read the same record. The commercial audience for your PSC history is wider than the regulatory one.
Why the regional record follows you out of the region
An operator who thinks of Asia-Pacific as one trading area among several tends to treat the PSC record it produces the same way. The arithmetic says otherwise.
It is where most of your history is made
With two thirds of calling ships inspected, a vessel in a regular regional trade accumulates more inspections here than anywhere else. The deficiency and detention history that drives targeting everywhere is largely written in this region.
History is not regional
A detention recorded in the Asia-Pacific sits in the ship’s record when it next calls in Europe. The regimes are separate; the reputation is not.
The company score travels with it
Because company performance aggregates across the fleet, a vessel trading exclusively in Asia can move the targeting of a sister ship that never leaves the Atlantic.
The practical consequence is that a fleet should not run two standards of preparation by region. The region with the highest inspection rate is the one setting the record that the quieter regions will read.
Using the published data on your own fleet
Because the regional data is published, the same figures that describe the region can be turned on a single operator. Three comparisons are worth making once a year, and none of them need anything the public record does not already contain.
Your deficiencies per inspection against the regional shapeIf fire safety is one finding in five across the region and one in three on your ships, that is a specific, actionable gap rather than a general sense that things could be better.
Your detention rate against 3.53 per centThe regional rate is the honest benchmark. A fleet above it is not unlucky, and a fleet well below it has something worth protecting and understanding.
Your exposure weighted by where you actually callA trade concentrated in higher-detention ports carries more risk per call than the regional average implies. Weight the comparison by destination rather than treating all calls alike.
Your working and living conditions shareAt roughly a tenth of regional findings, this is the clearest test of whether a technical department is covering the non-technical categories at all.
Preparing for an Asia-Pacific call
Regional preparation, as distinct from general inspection readiness, comes down to acting on what the numbers above actually say.
Weight the preparation to the destinationA call at an authority detaining above 5% is a different proposition from one at an authority near the regional average. Treat the higher-rate ports as the ones worth a superintendent’s attention in advance.
Start with fire safety, every timeOne deficiency in five in this region is a fire safety item. If preparation time is limited, that is where it returns most, and it is almost entirely verifiable in advance.
Do not skip working and living conditionsTen per cent of findings, and the category least likely to be covered by an engineering walk-round. Rest hours, accommodation, catering and crew documentation need their own check.
Clear carried-forward items firstBecause reports move through the regional system, an open item from a previous call is visible and will usually be the starting point of the next inspection.
Assume you will be inspectedTwo thirds of ships calling in the region were. Planning on the basis that an inspection is unlikely is planning against the published odds.
Brief the crew on the interview, not just the kitFire safety and life-saving findings frequently come from a demonstration rather than an examination. The ability to show the thing working matters as much as its condition.
How Marine Inspection prepares a vessel for the region
Everything above points the same way: in a region that inspects two thirds of arrivals and publishes the results, the ship’s own record is both the exposure and the defence. Managing it is a records discipline.
From the regional numbers to what the system does
Fire safety and LSA checked internally firstInternal inspections built around the categories that carry a third of regional findings, so the items most likely to be examined are the items already verified.
Working and living conditions in scopeRest hours, accommodation and crew documentation treated as items open to inspection, with records behind them, rather than as somebody else’s department.
Carried-forward items visible before arrivalOpen deficiencies shown against the vessel ahead of the call, because the next authority can already see them.
History by region and by portWhere the ship was last inspected and what was found, which is what both the targeting and your own planning run on.
Repeats caught across the fleetA finding recurring on several ships surfaced early, before an authority reads it as a management failure.
In a region that inspects two thirds of arrivals, the record is the preparation
Marine Inspection keeps internal inspections aligned to what PSC examines, shows open items before the port call and surfaces the repeats that turn a ship problem into a company one.
How likely is a ship to be inspected in the Asia-Pacific region?
Very. The region recorded 35,546 inspections covering 19,980 individual ships, against roughly 30,046 ships visiting — an inspection rate of about 66 per cent. For a vessel in a regular regional trade, inspection is a recurring condition rather than an occasional event.
What is the regional detention rate?
3.53 per cent, with 1,255 ships detained across 73 flags. Several individual Authorities report rates well above that figure, so the regional average understates the exposure at specific ports.
Which authority carries out the most inspections?
China, with 9,894 inspections representing 27.83 per cent of the regional total, followed by Japan at 4,014 (11.29 per cent), Indonesia at 3,736 (10.51 per cent) and Australia at 2,769 (7.79 per cent).
Which authority has the highest detention rate?
Of the figures reported, Singapore at 8.52 per cent — roughly two and a half times the regional average. China follows at 6.96 per cent, the Russian Federation at 5.64, the Republic of Korea at 5.44 and Australia at 4.80. All of those sit above the regional 3.53 per cent.
What deficiencies are most common in the region?
Of 90,168 deficiencies recorded, fire safety accounted for 18,020 (19.98 per cent), life-saving appliances 11,818 (13.11 per cent), working and living conditions 9,108 (10.10 per cent) and safety of navigation 8,936 (9.91 per cent) — just over half the total between them.
What is APCIS?
The regional information system. Member Authorities connect to it online or by web service both to search for ships to inspect and to input and transmit inspection reports, from a central data centre, with the data published on the Tokyo MoU website. Your record is therefore an input to targeting before anyone boards.
How many authorities are in the Tokyo MoU?
Twenty-two full member Authorities, applying a common regime with their own inspection volumes and detention thresholds — which is why exposure varies by where a vessel calls rather than only by how it is run.
Where should limited preparation time go?
Fire safety first, because it is one deficiency in five across the region and almost entirely verifiable in advance. Then life-saving appliances, then working and living conditions — the last being the category technical teams most often leave out of their own checks.
Asia-Pacific calls
Prepare for the port you are going to, not the region in general
Marine Inspection holds inspection history by vessel and region, open items with their deadlines, and internal checks aligned to the categories that carry most of the regional findings — so a call at a high-detention port is prepared for differently from a routine one.