A fleet PMS can show a green completion rate while one vessel runs a critical pump past its interval. A good dashboard makes that vessel impossible to miss. This guide sets out the KPIs a technical superintendent can use to read maintenance performance across a fleet: what BIMCO and the ISM Code say, what we suggest on top, and how to keep the numbers honest. For setting up the system behind the figures, see our planned maintenance system setup guide for ships.
What the Standards and Regulators Actually Say About PMS Measures
How BIMCO defines the overdue tasks indicator and what it leaves open
BIMCO's SHIP PI documentation defines overdue tasks in PMS as the outstanding planned maintenance tasks for individual vessels, as a percentage, reported at ship level. It is captured quarterly as an average of the previous three months. The page does not define when a task counts as overdue and does not treat critical equipment separately. Those two decisions are left to the company, which is why a written company definition matters.
Why critical equipment needs its own line, from the ISM Code and port State control
ISM Code section 10.3 asks companies to identify equipment and technical systems whose sudden failure may create hazardous situations. A German ISM circular says safeguards include regular testing of standby equipment, and that supporting maintenance should be integrated into the ship's maintenance plan. AMSA says its port State inspectors focus on planned maintenance of propulsion and auxiliary equipment. A blended completion figure cannot show any of this, so critical jobs need a line of their own. For a fleet-level view of the same idea, see our {L2}.
The Core KPIs: Definitions, Questions and Where Each Comes From
Six measures that together show whether the plan is being followed and proved
The table lists the six measures we recommend on a technical superintendent's dashboard. Only the first has a sourced definition. The rest are our suggestions, chosen because each answers a different question and none can be satisfied by gaming another one. Adapt the definitions to your company and write them down.
| KPI | Suggested definition | Question it answers | Source status |
|---|---|---|---|
| Overdue tasks in PMS | Outstanding planned tasks divided by tasks due in the period, per ship | Is work falling behind? | BIMCO SHIP PI PI065 and KPI036 |
| Overdue critical jobs | Count of overdue jobs on the company's critical equipment list | Is anything that matters unattended? | Our suggestion, based on ISM 10.3 |
| Completion rate on time | Jobs closed by their due date divided by jobs due | Is the plan being followed? | Our suggestion |
| Backlog trend | Open jobs per month, compared with the prior months | Is work arriving faster than it closes? | Our suggestion |
| Deferral count | Jobs moved past their due date, with reason and approver | Are due dates being stretched? | Our suggestion |
| Evidence rate | Closed jobs with a photo, reading or report attached divided by closed jobs | Can we prove the work? | Our suggestion |
- Overdue critical jobs
- Completion rate on time
- Deferrals and extensions
- Backlog trend
- Breakdowns of critical equipment
- Unplanned repair spend
- Findings at inspections and surveys
- Downtime or off-hire days
Designing the Fleet Dashboard: Layout, Trends and Triage
What belongs on the top row and how to rank vessels by risk
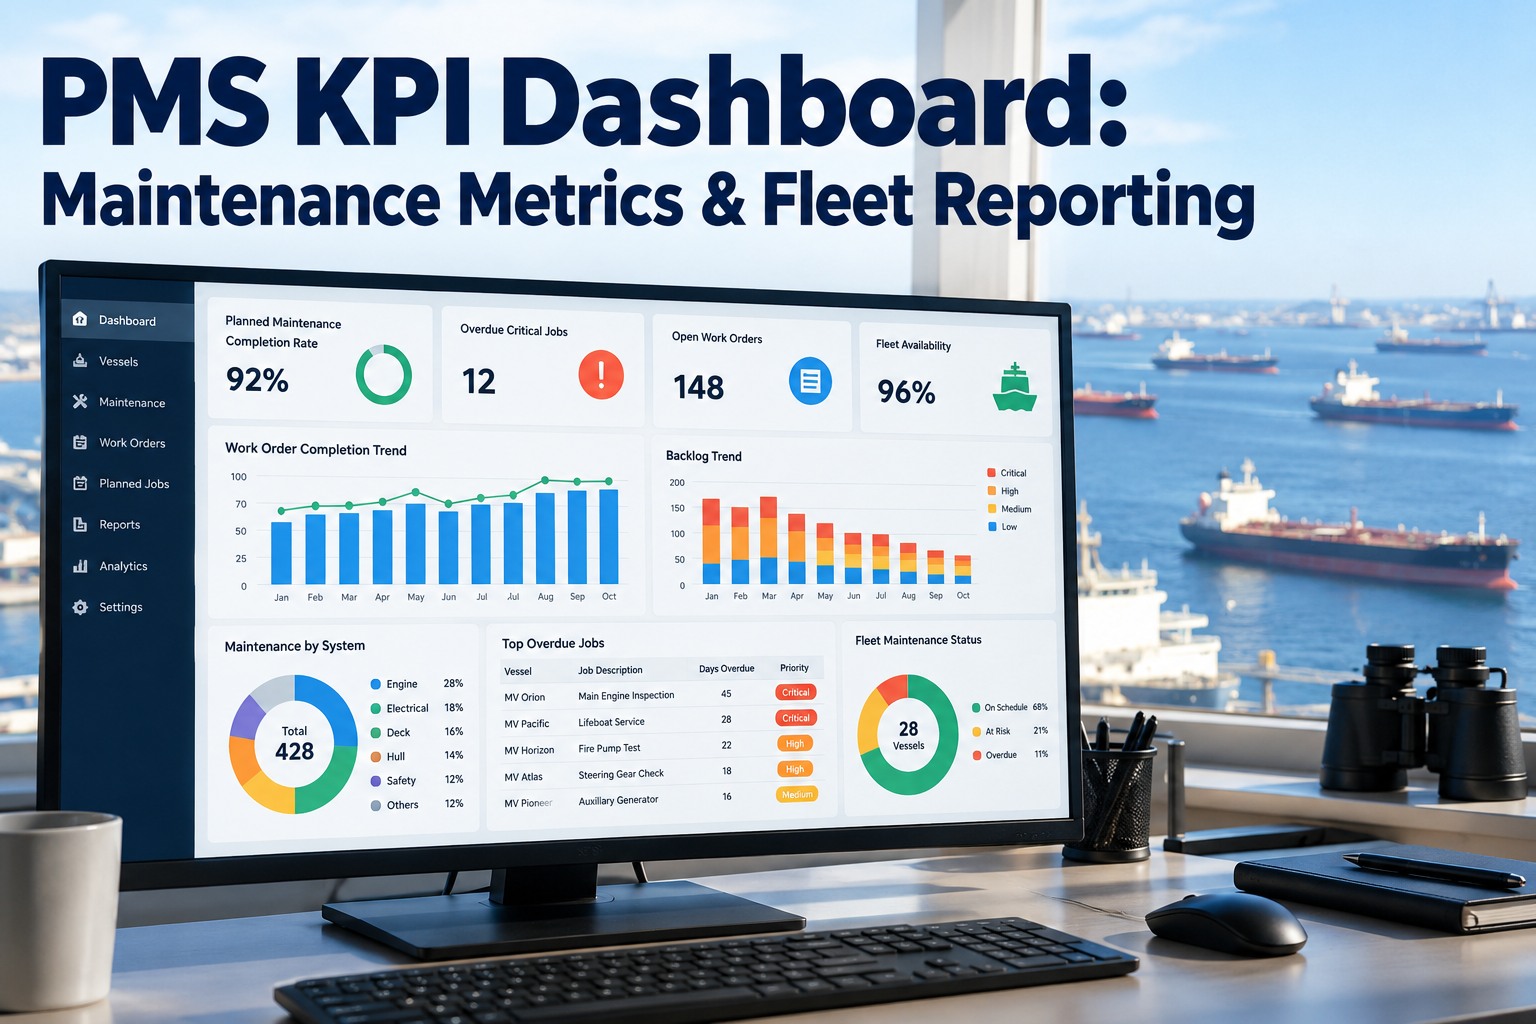
Put the four most urgent measures on the top row: completion on time, overdue critical jobs, open backlog and recent deferrals. Below them, show a vessel table sorted by risk, not by name. The wireframe below uses invented numbers to show the layout.
How to read a backlog trend without being fooled by sudden drops
A backlog that rises for several months suggests work is arriving faster than crews or yards can close it. A sudden fall deserves a question: were jobs completed with evidence, or closed in bulk or deferred? The chart uses invented data to show the shape.
How an overdue job should be triaged depending on whether the equipment is critical
Not every overdue job carries the same risk. The outline below separates critical equipment, which goes to the superintendent with dated evidence and a standby check, from non-critical equipment, which is re-planned with a reason on record.
Reporting Rhythm: Weekly on Board, Monthly Across the Fleet, Quarterly for Management
Who should look at which number and how often
A dashboard only helps if someone reads it on a schedule. BIMCO's overdue tasks indicator is quarterly. We suggest a weekly review of overdue and critical jobs on board, a monthly fleet review by the superintendent, and a yearly review of the targets and the critical equipment list. Only the quarterly basis comes from a source.
Targets and Alert Thresholds: Deciding When a Number Turns Red
Why thresholds should be set by the company, tested on real data and reviewed each year
None of the sources we read give a target for overdue tasks or completion rate, and we have not seen an industry benchmark we can verify. That is a gap to fill honestly. Start by pulling twelve months of your own data, see where vessels actually sit, then set thresholds that separate normal variation from a real problem. Write down who owns each threshold and review it yearly with the critical equipment list.
| KPI | Green when | Amber when | Red when | Who acts |
|---|---|---|---|---|
| Overdue critical jobs | Zero | Set by the company | Any overdue beyond the agreed limit | Technical Superintendent |
| Overdue tasks in PMS | Within your own range | Above range for one month | Above range for the quarter | Chief Engineer, then Superintendent |
| Completion on time | Within your own range | Falling for two months | Below range | Chief Engineer |
| Backlog trend | Flat or falling | Rising one month | Rising three months | Superintendent |
| Deferrals | Few and approved | Several in one month | Any without reason or approver | Technical Manager |
| Evidence rate | Within your own range | Slipping | Critical jobs closed without proof | Superintendent |
Using the Dashboard Before an Audit, a Vetting or a Port State Inspection
How the same figures answer an inspector's questions about planned maintenance
AMSA says its port State inspectors focus on planned maintenance of propulsion and auxiliary equipment and may require class surveyors to verify that critical equipment can operate under all voyage conditions. The ISM Code, as AMSA summarises it, requires inspections at appropriate intervals, reported non-conformities with corrective action, and records of these activities. A dashboard that shows overdue critical jobs, deferrals with reasons and closure evidence lets a superintendent see weak spots before an inspector does.
What to prepare for each vessel before the visit
Before a visit, filter the dashboard to the vessel and to critical equipment. Confirm every overdue critical job has a recorded reason, an approver and a new date. Check that recently closed critical jobs have evidence attached. Review standby equipment test records. None of this replaces the company's own procedures, but it turns a vague worry into a list of named jobs.
The PMS Dashboard Data Quality Checklist for Superintendents
A checklist with a checkpoint type on each item to confirm the numbers can be trusted
A KPI is only as good as the data behind it. Use the table to confirm the definitions are fixed, the evidence is attached and the figures match between ship and office.
| Item | What to check | Checkpoint type |
|---|---|---|
| Critical equipment list | Current, approved and flagged in the PMS so reports can split on it | Record |
| Definition of overdue | Written down once, with grace rules if any, and used on every vessel | Record |
| Due dates | Intervals match the maker's manual and the SMS, and are not edited without a reason | Record |
| Closure evidence | Closed jobs carry a date, name and proof where the job is critical | Record |
| Deferral approvals | Each extension has a reason, a new date and an approver | Record |
| Spot check on board | Pick closed critical jobs and confirm the equipment state and condition | Visual |
| Test of standby equipment | Standby equipment tests recorded and results reviewed | Test |
| Data feed | Vessel and office figures match after each sync | Test |
Mistakes That Make a PMS Dashboard Look Better Than the Fleet Really Is
Six habits that hide maintenance risk behind a healthy average
Systems That Keep Maintenance KPIs Tied to Evidence
How a dated photo repository, task ownership and deadlines make the numbers believable
A KPI is a claim until the work behind it can be shown. Marine Inspection supports a dated photo repository, observations turned into tasks with owners, deadlines and evidence, and certificate and equipment tracking. A dated photo of a serviced critical pump, a task for each overdue job with a named owner and a tracked deferral give a superintendent a dashboard they can defend in an audit. It does not replace the company's own PMS definitions or the class and flag requirements.