Every other manager in a shipping company wants their number to go down. The HSQE manager is the only one who has to walk into a board meeting and explain that a falling number might be the most dangerous signal in the fleet. In a 2026 industry benchmarking survey, safety leaders estimated that ninety percent of incidents, hazards and near misses at their organisations go unreported — up from seventy-nine percent a year earlier, while injury frequency and severity were rising. Underreporting is getting worse at exactly the moment the underlying risk is getting worse, which means the two most important numbers on your dashboard are moving in opposite directions and only one of them is visible. The reflexive explanation when reporting collapses is disengagement: people must not care enough to fill in the form. Decades of safety research point the other way, and one finding settles it — in a study of near-miss reporting behaviour, intent to report ran at seventy-eight percent while actual follow-through ran at twenty. People meant to report. Something between the intention and the record defeated them, and it was overload, organisation and fear of consequences rather than indifference. Start a free trial of Marine Inspection and work on the gap rather than on the attitude.
Near-miss reports across your fleet fell this quarter. Which is it?
Reading one
Fewer hazards
Conditions genuinely improved. Interventions worked, the fleet is safer, and the reporting decline reflects a real reduction in close calls. This is the reading everyone in the room would prefer, and it is occasionally correct.
Reading two
Fewer reporters
Nothing about the hazard changed. What changed is willingness — a new master, a poorly handled report, a busier trading pattern, or a form that got longer. The risk is identical and the visibility is gone, which is strictly worse than before.
The Gap Between Meaning To and Doing It
If underreporting were an attitude problem it would be nearly unfixable. The research says it is a friction problem, which is considerably better news. Book a Marine Inspection demo and attack the friction rather than the attitude.
Fifty-eight points of good intention, lost somewhere between the event and the record
Those figures come from cross-sector research into near-miss reporting behaviour rather than from a maritime study, and the mechanism transfers directly. The qualitative findings identified three causes: personnel, physical and mental overload; poor organisational structure around reporting; and fear of punitive consequences. Not one of them is indifference.
That matters enormously for what an HSQE manager should do next. A campaign urging people to care more addresses a cause that the evidence says is not operating. Removing thirty seconds from a reporting process, or removing a consequence somebody is afraid of, addresses causes that are.
A Near Miss Has No Forcing Function
Injuries and near misses reach the record by completely different routes, and understanding the difference explains why near-miss data is so much more fragile. Sign up for Marine Inspection and remove the step where the report dies.
An injury
Eventually produces something the organisation cannot ignore — a medical intervention, an insurance claim, a missed shift, a repatriation, a statutory notification. The event forces itself into the record whether or not anybody chooses to write it down. That is why injury data is comparatively reliable and why lagging indicators are the ones everybody has.
A near miss
Produces nothing at all unless someone chooses to speak. No cost, no claim, no absence, no paperwork trail generated by the event itself. The entire dataset exists only because individuals decided, one at a time, that it was worth the effort and the exposure — which makes it a measure of reporting conditions at least as much as a measure of hazard.
The consequence for your dashboard
Your near-miss distribution across the fleet is not primarily a map of where close calls happen. It is a map of where people are most willing to report them. Two vessels with identical hazards and different masters will produce very different numbers, and the vessel producing more is usually the one you should worry about least.
Book a Demo
Make reporting cost thirty seconds and the ninety percent starts moving. Nothing else you do will shift it as far.
Start Free Trial
Reading the Distribution as a Trust Map
Once you accept that report volume reflects willingness as much as hazard, the same data starts answering a different and more useful question. Schedule a walkthrough and see reporting rates compared across vessels rather than aggregated into a fleet figure.
The vessel reporting most
Usually your healthiest safety culture, and usually the one that looks worst on a naive dashboard. If you rank vessels by incident and near-miss count and congratulate the bottom of the list, you are rewarding silence and will get more of it within two crew rotations.
The vessel reporting almost nothing
Either genuinely exceptional or genuinely quiet, and the difference is not visible in the number. Cross-reference against defect rates, overdue maintenance, inspection findings and crew turnover before drawing any conclusion at all.
The vessel whose rate just dropped
The most informative signal available, and the most commonly missed. Something changed — a master, a manager, a trading pattern, or the handling of a specific report that everybody aboard heard about. Find out which before the next quarter.
The vessel whose rate just rose
Frequently an intervention working rather than a fleet deteriorating. A new master who visibly acts on reports produces a spike within weeks, and reading that spike as a decline in safety is how a good intervention gets reversed.
None of these readings are available from a fleet total. They require per-vessel comparison over time, with the changes flagged rather than the levels, and they require somebody to be able to ask what happened on that ship in March without waiting a fortnight for an answer.
Collected, Filed, Rarely Learned From
The second bottleneck sits after collection, and it is the one that quietly turns a safety programme into an administrative exercise. Start a free trial and check where your own reports currently stop.
Stage 1
Reported
Someone decided the event was worth recording and got past the form. On the evidence, roughly one in ten of the events that occurred reaches this stage at all.
Stage 2
Received
It arrives with an HSQE team that may be receiving dozens weekly, each requiring manual review. Reports accumulate faster than they can be processed, and the queue itself becomes the constraint.
Stage 3
Filed
Logged, categorised, closed. Compliance satisfied. Most systems are perfectly good at this and it is where the majority of reports finish their useful life.
Stage 4
Analysed across the fleet
Correlated across vessel, department, watch, equipment age, weather, cargo operation and supervisor to find the pattern. Conventional systems store the data and do not surface these relationships, so organisations collect near misses, file them, and rarely learn from them at scale.
Two separate bottlenecks, and improving one does not fix the other. A frictionless reporting channel that feeds a queue nobody can process produces more unread reports. An analysis capability fed by a suppressed reporting channel analyses a biased sample very precisely. Both have to move, and the sequencing matters — friction first, because analysis of a sample that reflects willingness rather than hazard will mislead you confidently.
Both bottlenecks, in one place
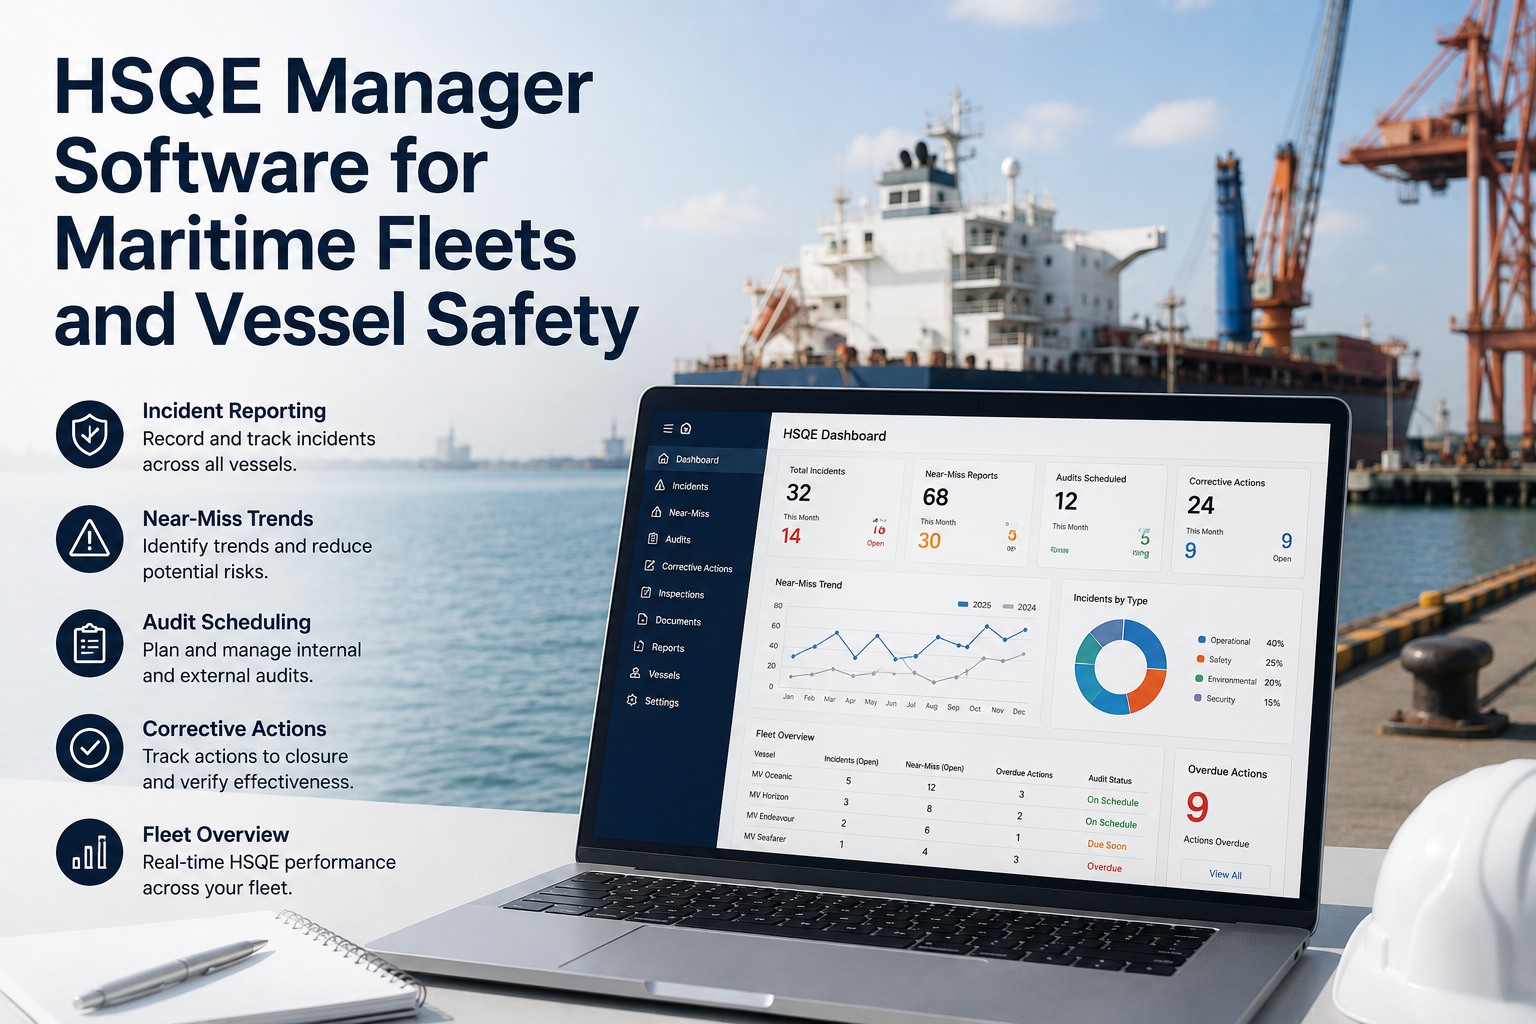
Reporting that takes seconds on the device a crew member already carries, offline, so the channel stops being the reason an event goes unrecorded. And findings held as structured data rather than as documents, so the same hazard recurring across four vessels reads as one pattern instead of four filings.
What the Maritime Framework Already Requires
The obligations here are clearer than in most safety domains, and they are worth quoting because they support the argument rather than merely constraining it. Book a walkthrough and map your own evidence against each line.
Table 1: The HSQE Obligation Set and What It Demands
The Pyramid, and Why Counting Injuries Is Managing Backwards
The structural argument for near-miss work is older than any software and remains the clearest justification available when asking for resources. Start a free trial and start measuring the base rather than the tip.
The tip
Fatalities and serious injuries. Rare, catastrophic, and the only part of the structure most reporting systems measure reliably. Industry statistics show real long-run progress here — one association's 2024 figures put the industry lost-time injury rate at 0.3 per million hours worked, roughly half the 2010 level.
The middle
Lost-time and recordable injuries. Still lagging, still after the fact, and still the layer most boards ask about. The same 2024 statistics record that around fifty-two percent of lost-time injuries were line-of-fire related — the category behavioural observation programmes are specifically designed to prevent.
The base
At-risk behaviours and near misses. Enormously more numerous, entirely invisible unless reported, and the only layer where intervention happens before somebody is hurt. Reduce the base and the tip reduces with it. A company that counts only injuries is managing safety through the rear-view mirror.
This is also the argument that unlocks budget, because it converts near-miss reporting from a compliance activity into a predictive one. The board is not being asked to fund paperwork. It is being asked to fund the only measurement that exists before the cost does.
HSQE Performance Is Commercial Performance
In the tanker and offshore trades particularly, the link between safety assurance and revenue is direct enough to make the resource conversation considerably easier. Schedule a demo and hold the evidence those assessments look for.
Charter acceptability
A strong assessment score under the tanker management framework is frequently a prerequisite for securing charters with oil majors. Safety performance is not adjacent to the commercial function — for a meaningful share of the fleet it is a gate on it.
Vessel acceptance
Findings on crew competency under the current vetting regime affect whether a vessel is acceptable. Since that regime assesses understanding in practice rather than documentation, it tests the same thing near-miss reporting depends on: whether people actually know what they are doing and will say so.
Risk profile and inspection frequency
Deficiency and detention history feed a risk profile that determines how often the vessel is inspected and how deeply. A pattern of open findings is read as a system that identifies problems and does not close them.
Insurance and claims
Underwriters assess claims record alongside management quality, and a demonstrable safety programme with evidence behind it is a materially different proposition at renewal from a set of procedures with thin records.
Evaluating a Platform as an HSQE Manager
Safety software is usually sold on module count. What determines whether it works is narrower: whether crews will use the reporting channel, and whether you can find a pattern once they do. Start a free trial and test both ends before anything else.
Table 2: Buyer Questions for HSQE Managers
2026 SAFETY DATA REALITY
The underreporting figures come from cross-sector safety research rather than from a maritime-specific census. The ninety percent estimate and its year-on-year rise are drawn from a 2026 industry benchmarking survey of safety leaders, and other published estimates put near-miss underreporting in a range from fifty to ninety percent depending on sector and method. Maritime-specific commentary places it above seventy percent. Treat the direction of travel as well evidenced and the precise figure as indicative. The intent-versus-follow-through finding is from healthcare research. The seventy-eight and twenty percent figures come from a study of nursing staff, and the mechanism — overload, organisational structure and fear of punitive measures — is what transfers rather than the exact numbers. Injury statistics vary by sector and association. Rates cited here come from one industry association's 2024 figures for its own membership and are not a whole-industry measure. The statutory obligations are unchanged. ISM Code requirements for reporting, investigation and analysis apply regardless of the software used to satisfy them.
Frequently Asked Questions
Is a falling near-miss rate good news?
Not without corroboration, and treating it as good news is the most common error in the discipline. A decline can mean fewer hazards or fewer reporters, and the number alone cannot distinguish between them. The practical test is to cross-reference against things that do not depend on voluntary reporting — injury and incident counts, defect rates, overdue maintenance, inspection findings and crew turnover. A vessel reporting five near misses a month while experiencing two incidents does not have few hazards; it has a culture that suppresses reporting. The most informative signal available is usually a rate that has just changed, in either direction, on a specific vessel.
How much goes unreported?
A great deal, and by most accounts the proportion is rising. A 2026 industry benchmarking survey found safety leaders estimating that ninety percent of incidents, hazards and near misses go unreported, up from seventy-nine percent the previous year, against a background of injury frequency and severity increasing. Other published estimates put near-miss underreporting between fifty and ninety percent depending on sector and method, with maritime commentary placing it above seventy percent. The direction is consistent across sources even where the precise figure is not, and it is moving the wrong way while operational pressure increases.
Why do crews not report when they intend to?
Research into reporting behaviour found intent to report running at seventy-eight percent against actual follow-through at twenty, and identified three causes for the gap: personnel, physical and mental overload; poor organisational structure around the reporting process; and fear of punitive measures. Those figures come from healthcare rather than shipping, but the mechanism transfers, and other work identifies the same causes plus not recognising an event as a near miss and lacking an easy channel. Paper forms and slow portals are described as actively discouraging participation. What is consistently absent from the evidence is indifference.
Why is near-miss data more fragile than injury data?
Because an injury forces itself into the record and a near miss does not. An injury eventually produces a medical intervention, an insurance claim, a missed shift or a statutory notification — something the organisation cannot ignore regardless of whether anyone chose to write it up. A near miss produces nothing at all unless someone decides to speak. The whole dataset therefore exists only because individuals repeatedly judged it worth the effort and the exposure, which means the distribution across your fleet reflects where people are willing to report at least as much as where close calls occur.
What does the ISM Code actually require here?
Section 9.1 requires the safety management system to include procedures ensuring that non-conformities, accidents and hazardous situations are reported to the company, investigated and analysed, with the objective of improving safety and pollution prevention. Three verbs rather than one, and the third is where most fleets are weakest — reporting and investigation tend to be well established while fleet-level analysis is thin. The IMO's near-miss reporting guidance adds the cultural dimension explicitly, acknowledging that the mechanism depends on conditions that a procedure alone cannot create.
How do I make the resource argument to the board?
Two arguments work, and they are stronger together. The structural one is the safety pyramid: at-risk behaviours and near misses form the base, injuries and fatalities the tip, and reducing the base reduces the tip proportionally — so a company counting only injuries is managing through the rear-view mirror and is asking to be surprised. The commercial one is more immediate in tanker and offshore trades, where a strong assessment score is frequently a prerequisite for charters with oil majors and vetting findings on crew competency affect vessel acceptability. Safety performance in those markets is a gate on revenue rather than a cost centre beside it.
The Number You Need to Go Up
Fix the channel first
Reporting in seconds on the device a crew member already carries, working offline, with an anonymous route available because fear of consequence is an evidenced cause rather than a theoretical one. Ninety percent is a friction figure before it is anything else.
Then find the pattern
Findings held as structured data so the same hazard on four vessels reads as one pattern, rate changes flagged per vessel rather than averaged into a fleet total, and closure that requires evidence rather than a status change.