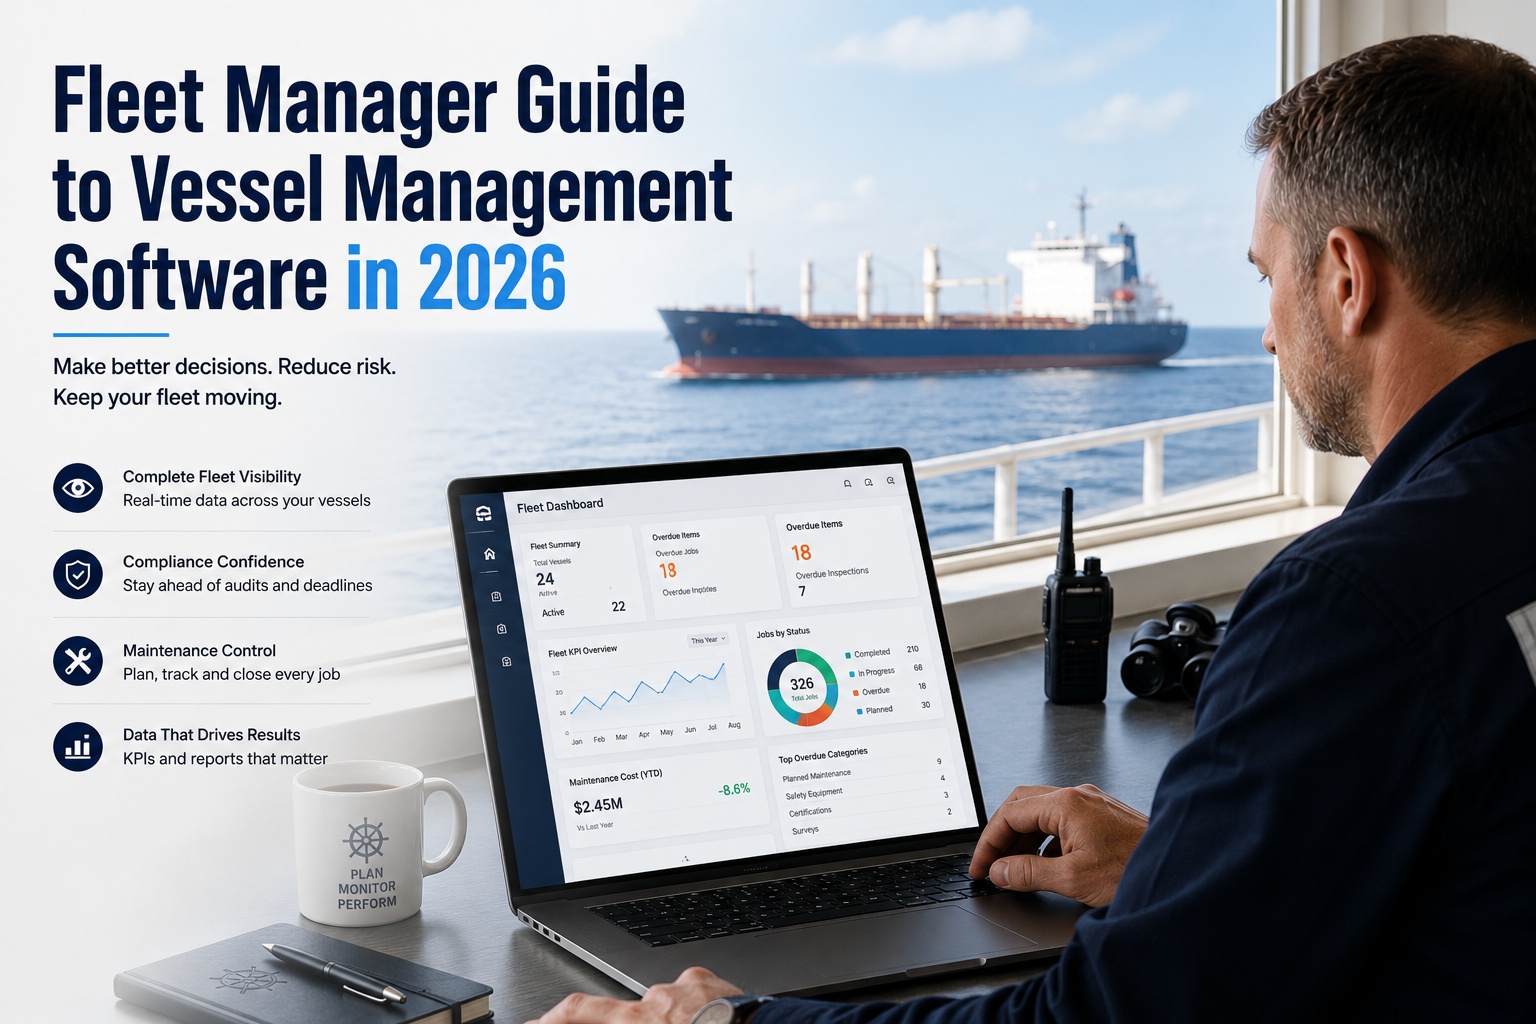
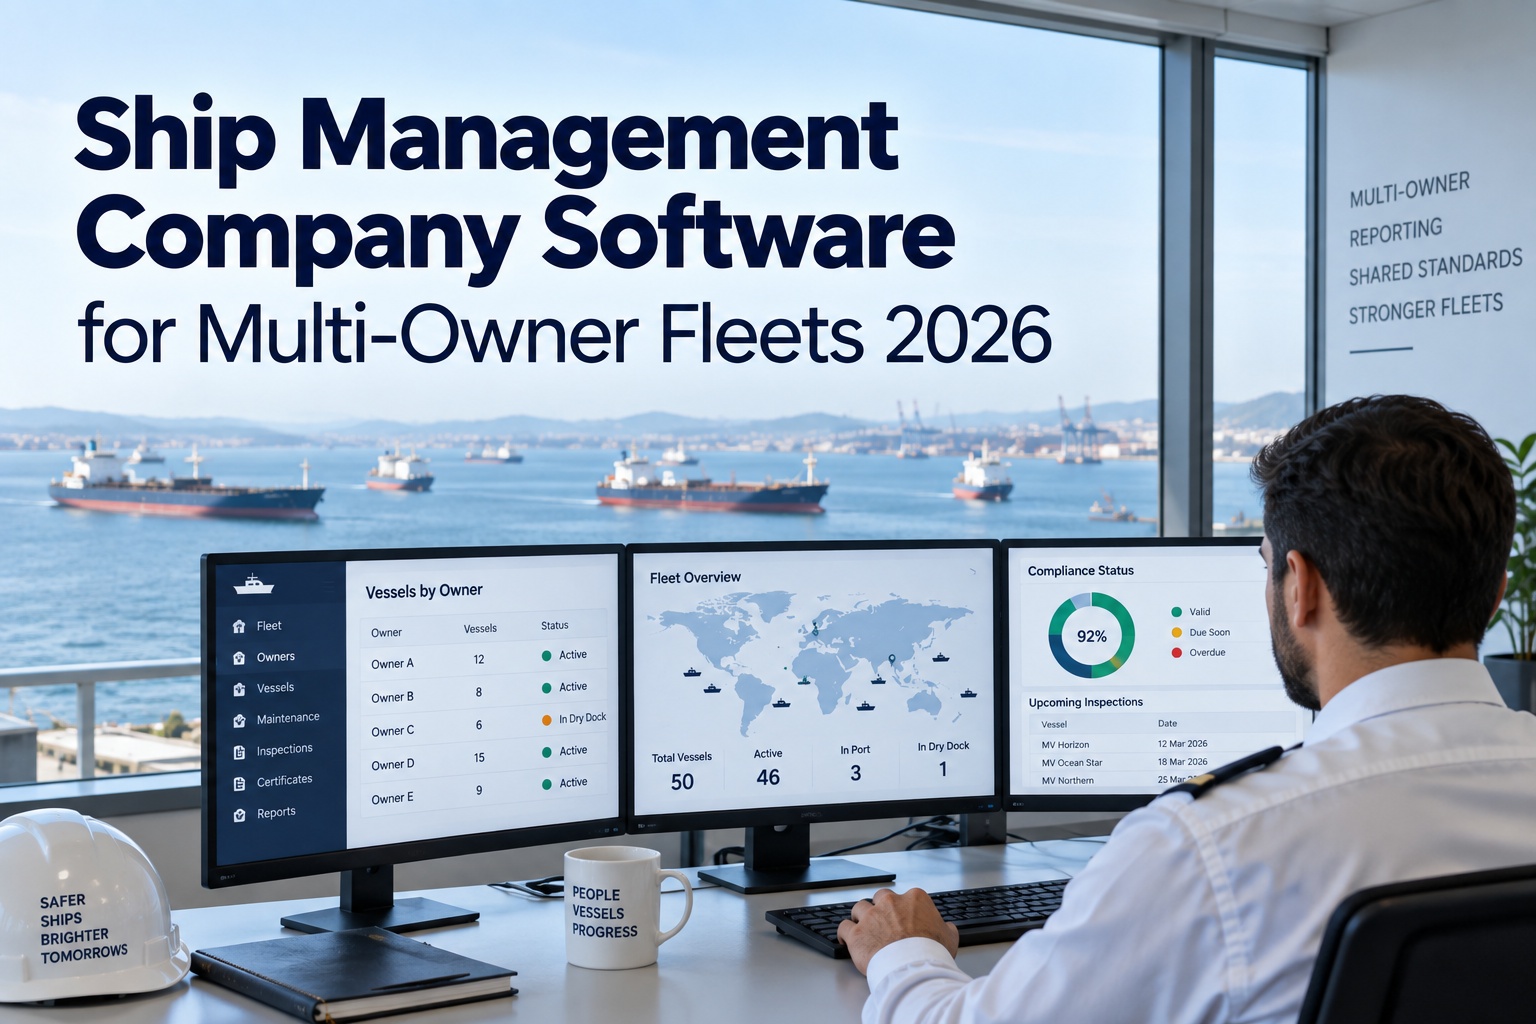
Most fleet managers discover a problem during an inspection rather than before one. A Port State Control detention, a failed vetting, an off-hire dispute — none of these are sudden events. Each is the visible end of a chain of untracked failures that a structured set of indicators would have surfaced months earlier. That is the whole argument for fleet software, and it is a narrower argument than most vendors make. The purpose is not visibility for its own sake, and certainly not more reporting. It is to make the chain visible while it is still a chain. Industry guidance for 2026 is consistent and refreshingly subtractive on how to do that: pick eight to twelve indicators that trigger actions, assign an owner to each trigger, keep a short evidence trail, and remove anything that does not change a decision. Note what that instruction implies about most dashboards. If a metric moves and nobody does anything differently, it is not a control — it is decoration, and it is competing for attention with the four or five numbers that genuinely matter. Start a free trial of Marine Inspection and build the short list rather than the long one.
The selection rule worth adopting before you look at any platform
Eight to twelve indicators. An owner on each trigger. Delete everything that does not change a decision.
Test one
Does it trigger an action? If the number moves and no defined response follows, it is a report rather than a control.
Test two
Does one named person own the trigger? A metric owned by a department is owned by nobody at the moment it matters.
Test three
Is there a short evidence trail behind it? A number you cannot trace to source is a number you will not act on when acting is expensive.
Failures Are Chains. Dashboards Usually Show Events.
Understanding the shape of a failure explains why so much fleet reporting arrives too late to be useful, and it sets the test any platform has to pass. Book a Marine Inspection demo and see where in this sequence your current reporting picks the problem up.
Months out
Small things stop being recorded
A job closed without a measured value. A defect noted verbally at handover. An observation nobody logged because the shift was busy. Nothing is wrong yet, and nothing in the reporting registers a change.
Weeks out
Backlog accumulates unevenly
One vessel starts carrying older open items than the rest of the fleet. Aggregate completion percentages still look acceptable, because an average across eight ships hides a problem on one.
Days out
Leading signals appear, unread
Near-miss reports thin out. A drill slips. A corrective action from the last audit passes its date. Every one of these is visible in principle and none of them is on the report anyone reads.
The day itself
The event
A detention, a failed vetting, an off-hire claim. This is the first point at which most fleet reporting registers anything at all — which makes the report a record of what happened rather than an instrument for preventing it.
The practical test for any platform is simple and worth applying in the demo: at which of those four stages does it tell you something? A system that surfaces the event faster than email is a marginal improvement. A system that surfaces stage two — one vessel accumulating older open items than its sisters — is a different category of tool.
Forty Metrics Is the Same as None
Dashboard design has a well-documented failure mode, and it is not a shortage of data. Sign up for Marine Inspection and start from four numbers rather than forty.
Tier one
Four north-star indicators
Shown large, one per strategic pillar — cost, utilisation, safety and compliance. These are what you look at first and what you are accountable for. Four is the number because it is the number a person can carry between meetings without a screen.
Tier two
Four to six supporting metrics
A secondary band that explains why the north stars are moving. Diagnostic rather than directive. You consult these when a tier-one number changes and you need to know which vessel, which system or which crew.
Tier three
Everything else is a drill-down
Available when you go looking, absent when you are not. Not deleted from the system — deleted from the screen. The distinction matters, because the data is still needed and the attention is what is scarce.
The demo test
Ask to see the screen a fleet manager opens first — and count what is on it
If the answer is a wall of tiles, you are looking at a product designed to survive a feature comparison rather than a Monday morning. Four numbers large, a handful of diagnostics beneath, and everything else one click away is not a limitation. It is the design decision that determines whether anybody uses it in six months.
Lagging Indicators Tell You What Happened. Leading Ones Tell You What Is About To.
Most fleet reporting is almost entirely lagging, which is why it functions as a history report presented as a control panel. The split is worth being explicit about. Schedule a walkthrough and check the ratio on your own current reporting.
Lagging
Accurate, auditable, and too late to act on
Lost time injury frequency
Total recordable case frequency
Port State Control deficiencies per vessel per year
Detentions and failed vettings
Dry-dock cost against budget, after the yard period
Essential for accountability and for demonstrating performance to owners and charterers. Useless as an early warning, because by definition the thing has already occurred.
Leading
Noisier, softer, and the only ones you can still act on
Near-miss reporting rate
Observation reporting rate
Drill completion rate
Non-conformity corrective action closure rate
Age of the oldest open defect, by vessel
Described in industry guidance as the more actionable set, and consistently the smaller half of a typical fleet dashboard. Reversing that ratio is the single highest-value change available to most fleet managers.
The counter-intuitive part, and it catches good managers out
On the leading side, rising numbers are usually good news. A near-miss reporting rate going up means people are reporting, not that the fleet has become more dangerous. An observation rate going up means crews are looking. A manager who praises the vessel with the fewest near-misses and questions the one with the most is rewarding silence and punishing visibility — and will get exactly what they rewarded, which is a fleet that reports nothing until something breaks. Leading indicators have to be read in the opposite direction to lagging ones, and a dashboard that presents both in the same visual language invites precisely that mistake.
The Indicator Set Worth Building
Below is a working shortlist, held to the eight-to-twelve rule, with what each one actually reveals and the action it should trigger. Adopt, adapt or reject — but do it deliberately rather than accepting whatever a platform ships with. Start a free trial and configure to this shape.
Table 1: A Fleet Indicator Set That Passes the Three Tests
Eleven indicators. Each with an owner. Each with a defined response.
That is a control system. A screen with forty tiles and no assigned triggers is a report that happens to be interactive.
One Metric Almost Every Fleet Reports Wrongly
Mean time to repair is systematically understated across most operations, and the reason is a definition problem rather than a data problem. It matters because it flatters every fleet that uses it and hides the interval where the real cost sits. Book a walkthrough and check where your own clock starts.
What is measured
Total repair hours divided by number of repairs, with the clock running from the moment a work order is opened in the system to the moment it is closed.
What is missing
Everything between the moment the problem was first noticed and the moment somebody created the work order. On a vessel that can be hours, and on a defect noticed at sea and raised in port it can be days. That interval is invisible to the metric and entirely real to the operation.
Why it flatters
The worse a fleet's capture discipline, the later work orders get raised, and the shorter the measured repair time appears. A fleet with poor reporting can post better mean time to repair than a fleet with excellent reporting, purely as an artefact of when the clock starts.
What to do about it
Measure from first report rather than from work order creation, which requires the first report to exist as a timestamped record. That is only possible if the person who noticed the problem could log it in seconds, where they were standing, without opening a laptop. The metric fix and the capture fix are the same fix.
Where the Money Actually Leaks
Published fleet analysis is consistent that a meaningful share of annual budget is lost to two causes that a maintenance record can address, and neither of them is dramatic enough to get attention on its own. Start a free trial and find out which of the two is yours.
Underutilisation of assets
Capacity paid for and not used, or used below the level the asset was specified to deliver. Visible only where utilisation is measured against a stated baseline rather than reported as a raw figure.
Poor compliance with maintenance schedule
Work not done on time, done late at higher cost, or deferred into a yard period at yard rates. Individually small, cumulatively the larger of the two on most fleets.
Estimated at five to ten percent of annual budget
Published fleet analysis puts the combined waste in that range. Whether your own fleet sits at the top or the bottom of it is not knowable from a budget report, because a budget report tells you what was spent rather than what was avoidable.
Benchmarks worth knowing, and treating carefully
Commonly cited figures include a global Port State Control detention rate of around two per cent of inspections, with one deficiency or fewer per inspection regarded as strong performance and zero detentions as the goal. White-list status under the Paris and Tokyo memoranda depends on consistent compliance rather than on a good year. On the technical side, published guidance treats maintenance cost above a low single-digit percentage of asset replacement value as a signal of ageing assets or reactive maintenance dominance. Treat all of these as orientation rather than as targets: they come from mixed sources, vary substantially by vessel type and trade, and a number borrowed from another fleet's profile can mislead more effectively than no number at all.
Evaluating a Platform as a Fleet Manager
Vendors demonstrate breadth because breadth wins feature comparisons. These questions test the things that determine whether a platform is still in daily use a year after purchase. Schedule a demo and drive it yourself rather than watching it driven.
Table 2: Buyer Questions for Fleet Managers
2026 FLEET MANAGEMENT REALITY
Benchmarks in this field come from mixed sources and should be handled with care. The figures cited here — detention rates, deficiencies per inspection, maintenance cost as a share of asset value, and the five to ten percent budget waste estimate — are drawn from industry publications, vendor analysis and KPI guidance rather than from a single audited dataset. They vary considerably by vessel type, trade and region, and a target imported from another fleet's profile can be actively misleading. Use them to orient, then build your own baseline. Indicator definitions are not standardised. The same metric name can mean materially different things between platforms, most notably where a clock starts. Establish the definition before comparing a number to anybody else's. More reporting is not the goal. Guidance converges on eight to twelve indicators with assigned owners and defined actions, with everything else removed — which means a successful implementation should reduce what you look at rather than increase it. The statutory obligations sit underneath all of it. ISM Code Element 10 and the applicable class and flag requirements do not become optional because the dashboard is healthy.
Frequently Asked Questions
How many KPIs should a fleet actually track?
Industry guidance for 2026 converges on eight to twelve, chosen on a specific basis: each one should trigger an action, each trigger should have a named owner, each should have a short evidence trail behind it, and anything that does not change a decision should be removed. Dashboard design guidance adds a tiering recommendation — around four north-star indicators shown large, one per strategic pillar covering cost, utilisation, safety and compliance, with four to six supporting metrics beneath them and everything else available as a drill-down. The discipline is subtractive, and a good implementation should leave you looking at fewer numbers than before, not more.
Why do fleet dashboards stop being used?
Because a dashboard showing forty metrics with equal visual weight transfers the work of prioritising onto the person reading it, and people respond to that by not reading it. The documented result is dashboard fatigue. The failure is a design decision rather than a data problem, and it is not solved by adding filtering or configurability — those move the burden rather than removing it. The fix is a tiered layout where a small number of indicators carry visual priority and the rest are deliberately absent from the default view, available when somebody goes looking for them.
What is the difference between leading and lagging indicators here?
Lagging indicators record what has already happened — lost time injury frequency, total recordable case frequency, Port State Control deficiencies per vessel per year, detentions. They are essential for accountability and useless as early warning. Leading indicators are described in industry guidance as the more actionable set: near-miss reporting rate, observation reporting rate, drill completion rate and non-conformity corrective action closure rate. Most fleet dashboards are heavily weighted toward lagging metrics, which is why they function as history reports. Rebalancing toward leading indicators is generally the highest-value change available.
Why is a rising near-miss rate a good sign?
Because it measures reporting behaviour rather than incident frequency. A vessel with a high near-miss rate is one where people are noticing and recording things; a vessel with a low rate may simply be one where nobody reports. Managers who praise the ship with the fewest near-misses and question the one with the most are rewarding silence, and they get what they reward — a fleet that reports nothing until something breaks. Leading indicators generally read in the opposite direction to lagging ones, which is a genuine hazard when both are presented in the same visual language on the same screen.
Why is mean time to repair usually understated?
Because the clock conventionally starts when a work order is opened rather than when the problem was first reported, and the interval between those two moments is invisible to the metric. On a vessel that gap can run to hours or, for a defect noticed at sea and raised in port, to days. The perverse consequence is that the worse a fleet's capture discipline, the later work orders are created and the shorter its measured repair time appears — so a fleet with poor reporting can post better figures than one with excellent reporting. Measuring from first report requires the first report to exist as a timestamped record, which makes the metric fix and the capture fix the same fix.
What should I test in a vendor demonstration?
Four things, in this order. What appears on the first screen a fleet manager sees, and how many items are on it. Whether the system shows you the vessel diverging from its sisters rather than only a fleet average, since averages across eight ships conceal a problem on one. Where the repair clock starts, and whether the vendor recognises why that matters. And what closing a job looks like on a phone in a machinery space, because dashboard quality is bounded by capture quality and no amount of shore-side presentation improves data that was reconstructed at the end of a watch.
Build the Short List
Four numbers that carry accountability, a handful of diagnostics beneath them, and every remaining indicator available on request and absent by default. Owners on the triggers. Evidence two clicks from any figure. Outliers surfaced without being asked for. And a capture point on the device your crews already carry, because every number above it is only as honest as the moment it was recorded.