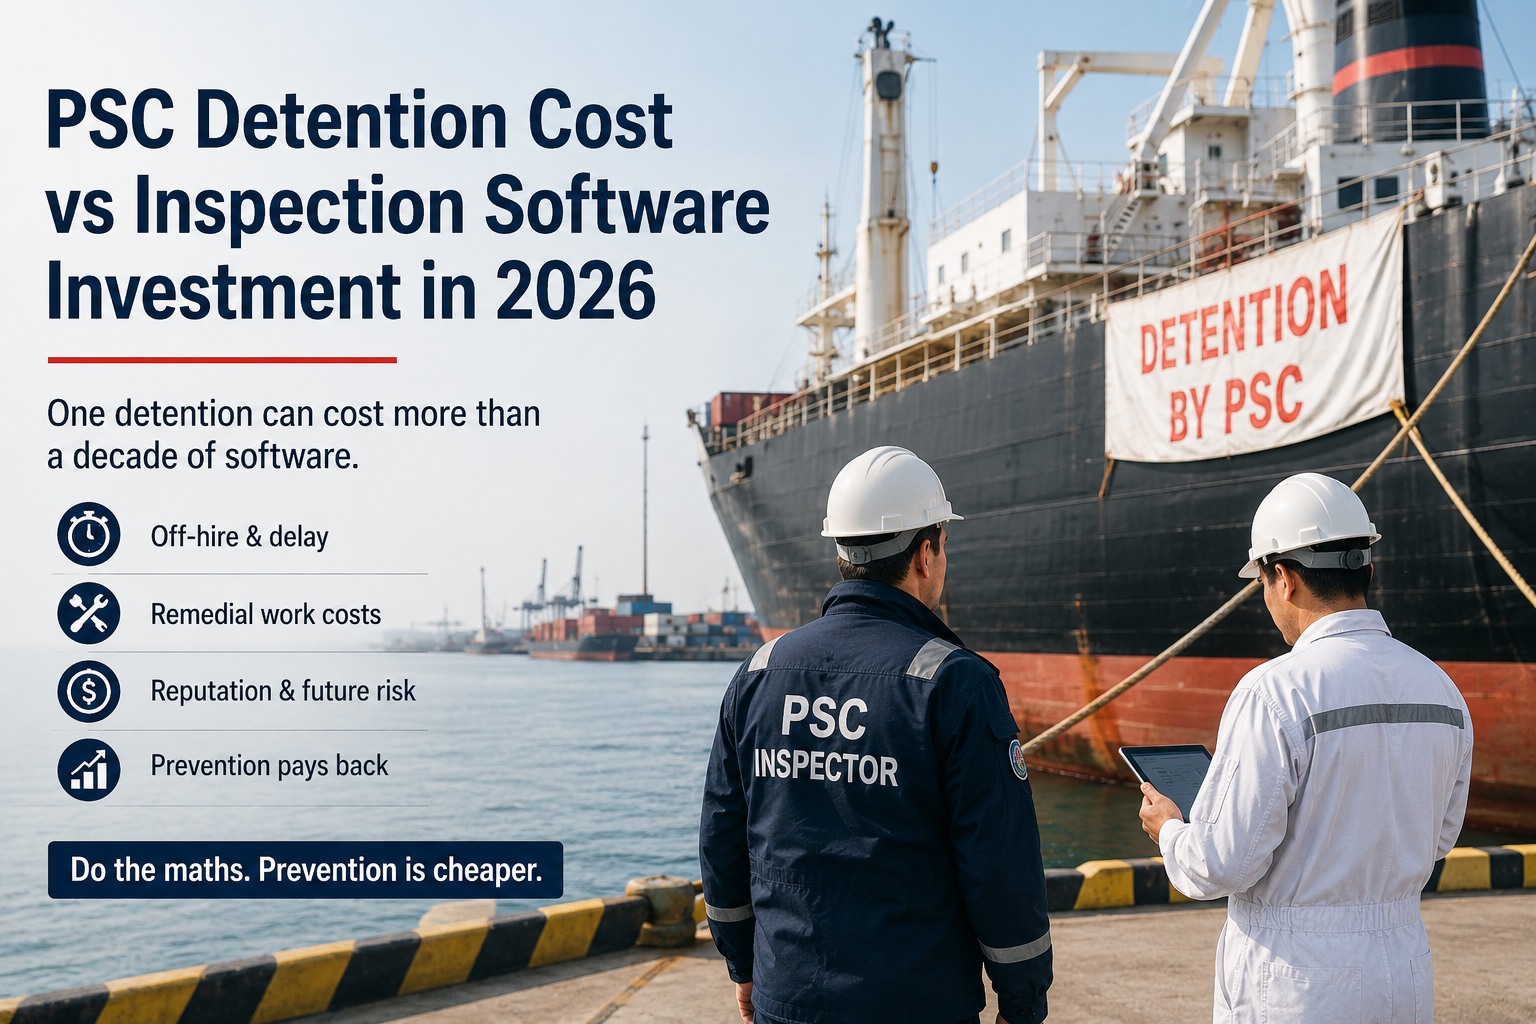
Two numbers published this year say more about detention risk than any cost estimate. A Survitec report presented at Posidonia in June 2026 found that Port State Control detentions have risen seventy percent over the past five years while the total number of inspections has remained flat. Read those together and the implication is uncomfortable: this is not an enforcement surge. The detention rate per inspection has risen, which means the condition of the inspected fleet has deteriorated rather than the inspectors having become stricter. The same analysis puts the consequence in terms an operator can act on — one in seven merchant vessels will likely be detained at least once in the next three years. That is a fourteen percent probability over a three-year horizon, which moves detention out of the category of tail risk and into the category of things you should be budgeting for. Independent Q1 2026 figures point the same way, with sixty-four detentions recorded across one classification society's fleet against fifty-two in the same period of 2025, a rise of more than twenty-three percent. This page works through what a detention actually costs, and checks the arithmetic against software pricing honestly rather than favourably. Start a free trial of Marine Inspection and reduce the probability rather than budget for the event.
Two Trend Lines, Five Years
Detentions
Up 70%
Over the past five years, according to analysis published at Posidonia in June 2026.
Inspections
Flat
The total number of inspections has not risen over the same period.
What that combination means
If detentions rise while inspections do not, the proportion of inspections ending in detention has risen. That is a statement about the condition of the fleet being inspected rather than about inspector behaviour, and the report describes it in exactly those terms — a structural signal that fleet maintenance standards are deteriorating. The practical consequence for any individual operator is that the base rate has moved, and one in seven merchant vessels is now expected to be detained at least once within three years.
Six Cost Streams, and Only Two of Them Stop
A detention is usually discussed as a single number. It is six concurrent costs with different durations, and the ones that persist are the ones nobody puts in the estimate. Book a Marine Inspection demo and see the compliance position that keeps the vessel out of the first column.
Stream 1
Off-hire
The vessel is off-hire for the duration of deficiency rectification. Published figures put charter rates in the region of ten to eighteen thousand dollars per day, a single day of off-hire for a Panamax container ship at around twenty-five thousand, and larger container ships generating revenue in the region of forty to eighty thousand pounds per day.
Stops when the vessel sails
Stream 2
Port charges while alongside
The vessel continues to occupy a berth it is not working. Published estimates put port charges in the region of five to fifty thousand pounds per day depending on the port and the size of the vessel, and a detained ship has no leverage over which berth it occupies or for how long.
Stops when the vessel sails
Stream 3
Mobilisation
Technicians and spares brought to a port that was not planned for it, at short notice, at whatever the expedited rate happens to be. This is the cost most sensitive to how good your records were — a fleet that knows what is aboard mobilises less.
Stops, but at premium rates throughout
Stream 4
Commercial damage
Damage to the charterer relationship, and potentially charter party claims — a charterer may claim damages for delay, lost cargo revenue or breach, and charter party clauses frequently include penalties for off-hire time caused by detention.
Outlasts the detention
Stream 5
Risk profile degradation
The detention enters the vessel's record on THETIS and Equasis, degrading the risk profile and increasing the likelihood of future targeted inspections. The record follows the ship across every memorandum database worldwide, and risk profile is one of the factors determining inspection frequency.
Does not stop — it compounds
Stream 6
Insurance
Potential impact on premiums at renewal. Underwriters assess claims record alongside management quality, and a detention is a data point in that assessment that persists across renewal cycles rather than clearing when the vessel sails.
Persists to the next renewal and beyond
Streams one and two dominate the conversation because they are easy to calculate. Streams five and six are the reason a detention estimate based only on days alongside understates the total — and stream five is the one that changes the probability of the next detention, which is a category of cost with no natural end point.
The Compounding Loop
This is the mechanism that makes a second detention more likely than the first, and it is the strongest argument against treating detention as an isolated event with a one-off cost. Sign up for Marine Inspection and break the loop at the point where it is cheapest.
Stage one
A detention occurs
Frequently from an accumulation of findings across unrelated areas rather than from a single catastrophic fault, with common triggers including malfunctioning lifesaving and firefighting equipment, expired certification and environmental violations.
Stage two
The record is published
It enters the regional memorandum database and the vessel's profile on THETIS and Equasis, where it is visible to port authorities, charterers and vetting inspectors. This is not a filing — it is a permanent public change to the ship's standing.
Stage three
The risk profile degrades
Risk profile is built from age, flag, company performance and deficiency history, and it determines inspection frequency — high-risk ships face inspection windows of around five to six months against twenty-four to thirty-six months for low-risk ships.
And back to stage one
More inspections, on a fleet whose condition has not changed
More frequent targeted inspection of a vessel with the same underlying condition produces more opportunities for the same accumulation to be found. The probability of the second detention is higher than the probability of the first was, and nothing about the ship needed to get worse for that to be true.
1 in 7
Merchant vessels expected to be detained at least once in three years
That is a base rate rather than a worst case, and it applies before you account for whether your own fleet sits above or below average on age, flag, company performance and deficiency history. Certificate windows escalating before they lapse, findings converted into tracked actions with closure evidence, and the accumulation of small items visible while it is still an accumulation — that is what moves a vessel down the risk profile rather than up it.
The Arithmetic, Done Honestly
The claim that one detention costs more than a decade of software is roughly right at the midpoint and misleading if stated flatly. Here is the range rather than the flattering end of it. Schedule a walkthrough and put your own charter rate into the calculation.
Detention cost
Published analysis puts a forty-eight to seventy-two hour detention at rarely less than eighty to one hundred and fifty thousand US dollars per vessel, counting off-hire, port costs, technician and spares mobilisation, commercial damage, ranking deterioration and potential insurance impact.
Software cost
Modern SaaS platforms are commonly reported around eight to fifteen thousand US dollars annually per vessel including software, updates and support, with implementation typically five to ten thousand one-time.
The honest range
At the least favourable reading — the cheapest detention against the most expensive software — a detention covers a little over five years. At the most favourable, the most expensive detention against the cheapest software, it covers roughly nineteen. The midpoint sits close to a decade, which is where the headline comes from. All three statements are true and only the range is honest.
Why even that understates
A prolonged or repeated detention is reported to scale the impact by an order of magnitude, and the range above prices a forty-eight to seventy-two hour event. It also excludes the compounding effect on inspection frequency entirely, because that cost has no defined end point and cannot be honestly bounded.
The caveat that matters
None of this establishes that software prevents a detention. It establishes the size of the event you are trying to make less likely. The honest claim is narrower: better records make some causes visible earlier — an approaching certificate expiry, an accumulation of open findings, a corrective action from the last inspection that was never closed — and some of those would have been acted on. What fraction of your own past detentions had a root cause of that kind is a question only your records can answer, and it is the number your business case should rest on rather than on any figure published here.
Off-Hire Exposure Starts Well Below Detention
Detention is the visible end of a spectrum. The same technical conditions produce hire deductions long before a Port State Control officer is involved, and that exposure is more frequent and less discussed. Start a free trial and look at the lower end of the spectrum as well as the top.
A partial breakdown
Under the full working order standard, even a minor impairment in cargo gear or power generation can trigger an off-hire clause and lead to a pro-rata deduction in hire. The threshold is whether the vessel can perform the service immediately required by the charterer, not whether it is seaworthy.
The measure that matters: net loss of time caused by the deficiency
A speed and consumption claim
Hull fouling has become a significant trigger for performance claims, and with the carbon intensity reduction factor tightening, hull inefficiency now risks both a fuel cost and a rating consequence requiring a corrective action plan.
Compounds slowly and is argued from records
A deficiency short of detention
Findings recorded without detention still enter the deficiency history that feeds the risk profile. They cost little on the day and contribute to the inspection frequency that determines future exposure.
Free at the time, expensive cumulatively
Detention
The end of the spectrum, and the only point at which the cost becomes impossible to ignore. Everything below it has been happening for some time on most vessels that reach it, which is why the accumulation matters more than the final finding.
The visible event at the end of an invisible sequence
What Actually Reduces the Probability
Not software in itself. Specific practices, some of which software supports and some of which it does not. Book a walkthrough and be clear about which column each item sits in.
Table 1: Detention Risk Reduction, and What Contributes
Software contributes to eight of those nine rows. It does none of them on its own, and the ninth is the biggest.
The Campaign Running Right Now
One near-term factor changes the probability for every vessel carrying cargo, and the preparation window is open rather than upcoming. Start a free trial and run the checklist internally before somebody runs it for you.
Live now
September to November 2026
Joint Paris and Tokyo MoU campaign on cargo securing
Inspectors are specifically targeting cargo stowage plans, securing equipment and crew familiarity with cargo securing procedures. The recommended preparation is straightforward and entirely achievable: review cargo securing documentation, conduct a physical equipment inspection, and run a documented crew drill.
Note the third item. A drill that happened and was not documented does not help you during a campaign that examines crew familiarity — and documentation failures are already among the leading causes of deficiency in ordinary inspections.
Building the Case From Your Own Numbers
Published averages are useful for orientation and weak as evidence. These questions convert them into something specific to your fleet. Schedule a demo and answer them from your own records first.
Table 2: Turning the Averages Into Your Own Figure
2026 DETENTION REALITY
The figures on this page come from industry reports, consultancy analysis and service-provider publications rather than from a single audited source. Detention cost bands, charter and port cost ranges, and the one-in-seven and seventy percent figures are drawn from published 2026 analysis and vary substantially by vessel type, size, trade, port and duration. Use them for orientation and build your case from your own charter rates and detention history. Software does not prevent detentions. It makes some causes visible earlier — approaching expiries, unclosed findings, accumulating deficiencies — and some of those would have been acted on. The physical condition of the vessel remains what is inspected, and maintenance remains what determines it. Risk profile mechanics vary by memorandum. Inspection windows, targeting factors and publication practice differ between regional memoranda, so confirm the position for the regions you actually trade in. Campaign details change. Concentrated inspection campaigns are announced with defined windows and topics; confirm the current campaign directly with the relevant memoranda rather than relying on any published summary including this one.
Frequently Asked Questions
How much does a Port State Control detention actually cost?
Published 2026 analysis puts a forty-eight to seventy-two hour detention at rarely less than eighty to one hundred and fifty thousand US dollars per vessel, counting off-hire, port costs, mobilisation of technicians and spares, commercial damage to the charterer relationship, deterioration of the memorandum performance ranking and potential impact on insurance premiums. A prolonged or repeated detention is reported to scale that impact by an order of magnitude. The underlying drivers vary widely — charter rates in the region of ten to eighteen thousand dollars a day, a Panamax container ship losing around twenty-five thousand per off-hire day, and port charges from five to fifty thousand pounds daily depending on port and vessel size.
Is it true that one detention costs more than a decade of software?
At the midpoint, roughly. Stated flatly, it is misleading, and the honest version is a range. Against modern SaaS pricing commonly reported at eight to fifteen thousand dollars per vessel annually, the cheapest detention set against the most expensive software covers a little over five years; the most expensive detention against the cheapest software covers around nineteen. The midpoint lands close to a decade, which is where the headline originates. The range also excludes the compounding effect on inspection frequency, because that has no defined end point and cannot honestly be bounded — so even nineteen years understates a repeated detention.
Why are detentions rising if inspections are not?
Because the proportion of inspections ending in detention has increased. Analysis published in June 2026 found detentions up seventy percent over five years against a flat inspection count, and described it as a structural signal that fleet maintenance standards are deteriorating rather than as an enforcement shift. Quarterly data supports the direction — one classification society recorded sixty-four detentions across its fleet in Q1 2026 against fifty-two in Q1 2025, more than twenty-three percent higher. The practical consequence is that the base rate has moved, with one in seven merchant vessels now expected to be detained at least once within three years.
Why does a detention make the next one more likely?
Because the record changes the vessel's targeting. A detention enters the regional memorandum database and the vessel's profile on THETIS and Equasis, degrading the risk profile and increasing the likelihood of future targeted inspections. Risk profile is constructed from age, flag, company performance and deficiency history, and it determines inspection frequency — high-risk ships face windows of around five to six months against twenty-four to thirty-six months for low-risk ships. More frequent inspection of a vessel whose underlying condition has not changed produces more opportunities for the same accumulation to be found, so the second detention is likelier than the first was.
Can software actually prevent a detention?
No, and it is worth being direct about that. What it does is make certain causes visible earlier — a certificate window approaching expiry, an accumulation of open findings across unrelated areas, a corrective action from a previous inspection that was never closed with evidence, a drill performed and not documented. Some of those would have been acted on had anybody seen them in time. The physical condition of the vessel is what an inspector examines, and maintenance is what determines it. The honest business case rests on what fraction of your own past detentions had a records-related root cause, which is a number in your inspection reports rather than in any vendor's material.
What should we do about the current inspection campaign?
The joint Paris and Tokyo memorandum campaign on cargo securing runs from September to November 2026, with inspectors specifically targeting cargo stowage plans, securing equipment and crew familiarity with cargo securing procedures. The recommended preparation is three concrete steps: review cargo securing documentation, conduct a physical inspection of the securing equipment, and run a documented crew drill. The word documented in that third step carries real weight during a campaign assessing crew familiarity — and documentation failures are already among the leading causes of deficiency in routine inspections, before any campaign scrutiny is applied.
Detentions up 70%
Inspections flat
One in seven vessels, three years
Change the Probability, Not the Budget Line
Certificate and survey windows escalating well before they lapse. Findings from the last inspection converted into assigned actions that cannot close without evidence. The accumulation of small items across unrelated areas visible as a running total rather than as separate entries in four files. Drills documented with named participation. And a risk profile moving in the direction that reduces inspection frequency rather than the one that increases it — which is the only cost stream on this page with no end point.